

Key Takeaways
- An M&E framework defines what you measure, how data is verified, who decides on it and when, not just a list of indicators.
- Design backwards from decisions. If no named person changes a decision because of an indicator, that indicator is overhead.
- Frameworks collapse on capacity, not concept. Run a load test: indicators × sites × frequency × minutes against available field hours.
- Only 152 of 531 disclosing NSE-listed companies reported any impact-assessment spend in FY 2024-25, totalling ₹42.58 crore.
- India's impact-assessment cost cap is 2% of CSR spend or ₹50 lakh, whichever is higher, not the widely republished 5% figure.
- Match claims to design. Pre-post measurement shows change over time; it never establishes that your programme caused it.
- The Global Fund recommends 5-10% of grants for M&E; the IFRC guide cites 3-10% as the working range.
- DPDP Rules were notified in November 2025, with core obligations from May 2027; build consent into forms now.
Of the 531 NSE-listed companies that voluntarily disclosed project-level CSR details for FY 2024-25, only 152 reported spending anything at all on impact assessment. Between them, ₹42.58 crore. Those same disclosures show ₹419.56 crore going to administrative overheads.
Part of that gap is structural. India's CSR rules cap administrative overheads at 5% of total CSR expenditure and impact-assessment costs at 2% or ₹50 lakh, whichever is higher, and the disclosure base here is voluntary and partial, so the comparison is indicative rather than exact. But the direction is hard to argue with: the sector spends considerably more on running programmes than on finding out whether they worked.
That is becoming an expensive habit. Independent impact assessment has been a statutory obligation for large CSR portfolios since 2021. SEBI's Social Stock Exchange reforms tied fundraising to an externally assessed impact report in September 2025. Assurance of BRSR Core disclosures reaches the top 1,000 listed companies in FY 2026-27, the financial year now running. And globally, the money has moved the other way: official development assistance from OECD DAC members fell 23.1% in real terms in 2025 to USD 174.3 billion, the largest annual contraction on record.
Less funding, more scrutiny. Which is why so many organisations are rebuilding their monitoring and evaluation systems right now, and why so many of those rebuilds will fail.
They fail for a reason that has nothing to do with evaluation theory. Most M&E frameworks are designed to survive a proposal review, not eighteen months of implementation. They are logically coherent and operationally impossible: forty indicators, quarterly household surveys, two field officers, and no named person who has to decide anything on the basis of any of it. Six months in, the spreadsheet stops being updated. Twelve months in, someone reconstructs the numbers from memory for the donor report.
This guide is about building the other kind.
Quick Answer: What Is A Monitoring And Evaluation Framework?
A monitoring and evaluation (M&E) framework is the document that specifies what an organisation will measure, how each measure is defined and collected, who verifies it, how often, and which decisions the resulting evidence is meant to inform. It sits between a Theory of Change, which explains why the programme should work, and day-to-day data collection, which produces the numbers.
A complete framework contains six components:
- a results chain,
- an indicator set with full definitions,
- baselines and targets,
- data sources and collection methods,
- roles and responsibilities including verification, and
- a use-and-review schedule.
Miss any one of the six, and you have an indicator list, not a framework.
Monitoring Vs Evaluation, And Why The Distinction Is Budgetary
Monitoring is continuous and internal. It tracks whether delivery is happening as planned: enrolment, attendance, supply, spend, coverage, so that deviation is caught early enough to correct.
Evaluation is periodic and analytical. It asks whether the intervention was worth doing: whether it was relevant, whether it worked, for whom, at what cost, and whether the benefits will last. Evaluation depends on design decisions made before the programme starts, which is why retrofitting it is expensive and often impossible.
The practical consequence shows up in the budget. Monitoring is a recurring operating cost, roughly flat across a programme's life. Evaluation is lumpy: a baseline at the start, sometimes a mid-term review, an endline at close. Organisations that budget a single blended "M&E" line almost always underfund the evaluation half, then discover in year three that they hold activity records where they needed evidence.
If the underlying vocabulary is contested inside your team, Relific's CSR and impact measurement glossary settles the 25 terms this field uses most inconsistently.
M&E Framework Vs M&E Plan Vs Logframe Vs Results Framework vs MEAL
Terminology genuinely differs between donors, and practitioner confusion here is not a competence problem. Here is how the documents differ in scope and use.
| Document | What it is | Primary audience | Typical length | When you need it |
|---|---|---|---|---|
| Theory of Change | The causal argument: why these activities should produce this change, under what assumptions | Internal, strategy, board | 1–3 pages plus diagram | Before design; revisited annually |
| Logical framework (logframe) | A matrix linking goal, outcomes, outputs and activities to indicators, means of verification and assumptions | Institutional donors | 1–3 pages | Almost always required in proposals |
| Results framework | A hierarchy of results without the assumptions column; common in multilateral and government programming | Donors, government partners | 1–2 pages | Portfolio and country-programme level |
| M&E framework | The operating specification: indicator definitions, baselines, targets, sources, frequency, responsibility, use | Programme and MEL teams | 5–20 pages plus indicator sheets | Once funding is confirmed, before implementation |
| M&E plan | Scheduled execution of the framework: calendar, sample sizes, budget, staffing, evaluation timeline | MEL lead, finance, field teams | 3–10 pages | Alongside the framework, updated annually |
| MEAL system | The framework plus accountability mechanisms (feedback and complaints) and structured learning | Whole organisation | Ongoing | Humanitarian work, and any programme with community accountability commitments |
The distinction that matters most in practice: a logframe summarises your work for someone outside the organisation; an M&E framework instructs the people inside it. A logframe says "80% of trained farmers adopt at least two practices". A framework says who asks, of which sample, using which observation rubric, at what interval, verified how, entered where, and reviewed by whom on which date.
Why Most M&E Frameworks Stop Working Within Eighteen Months
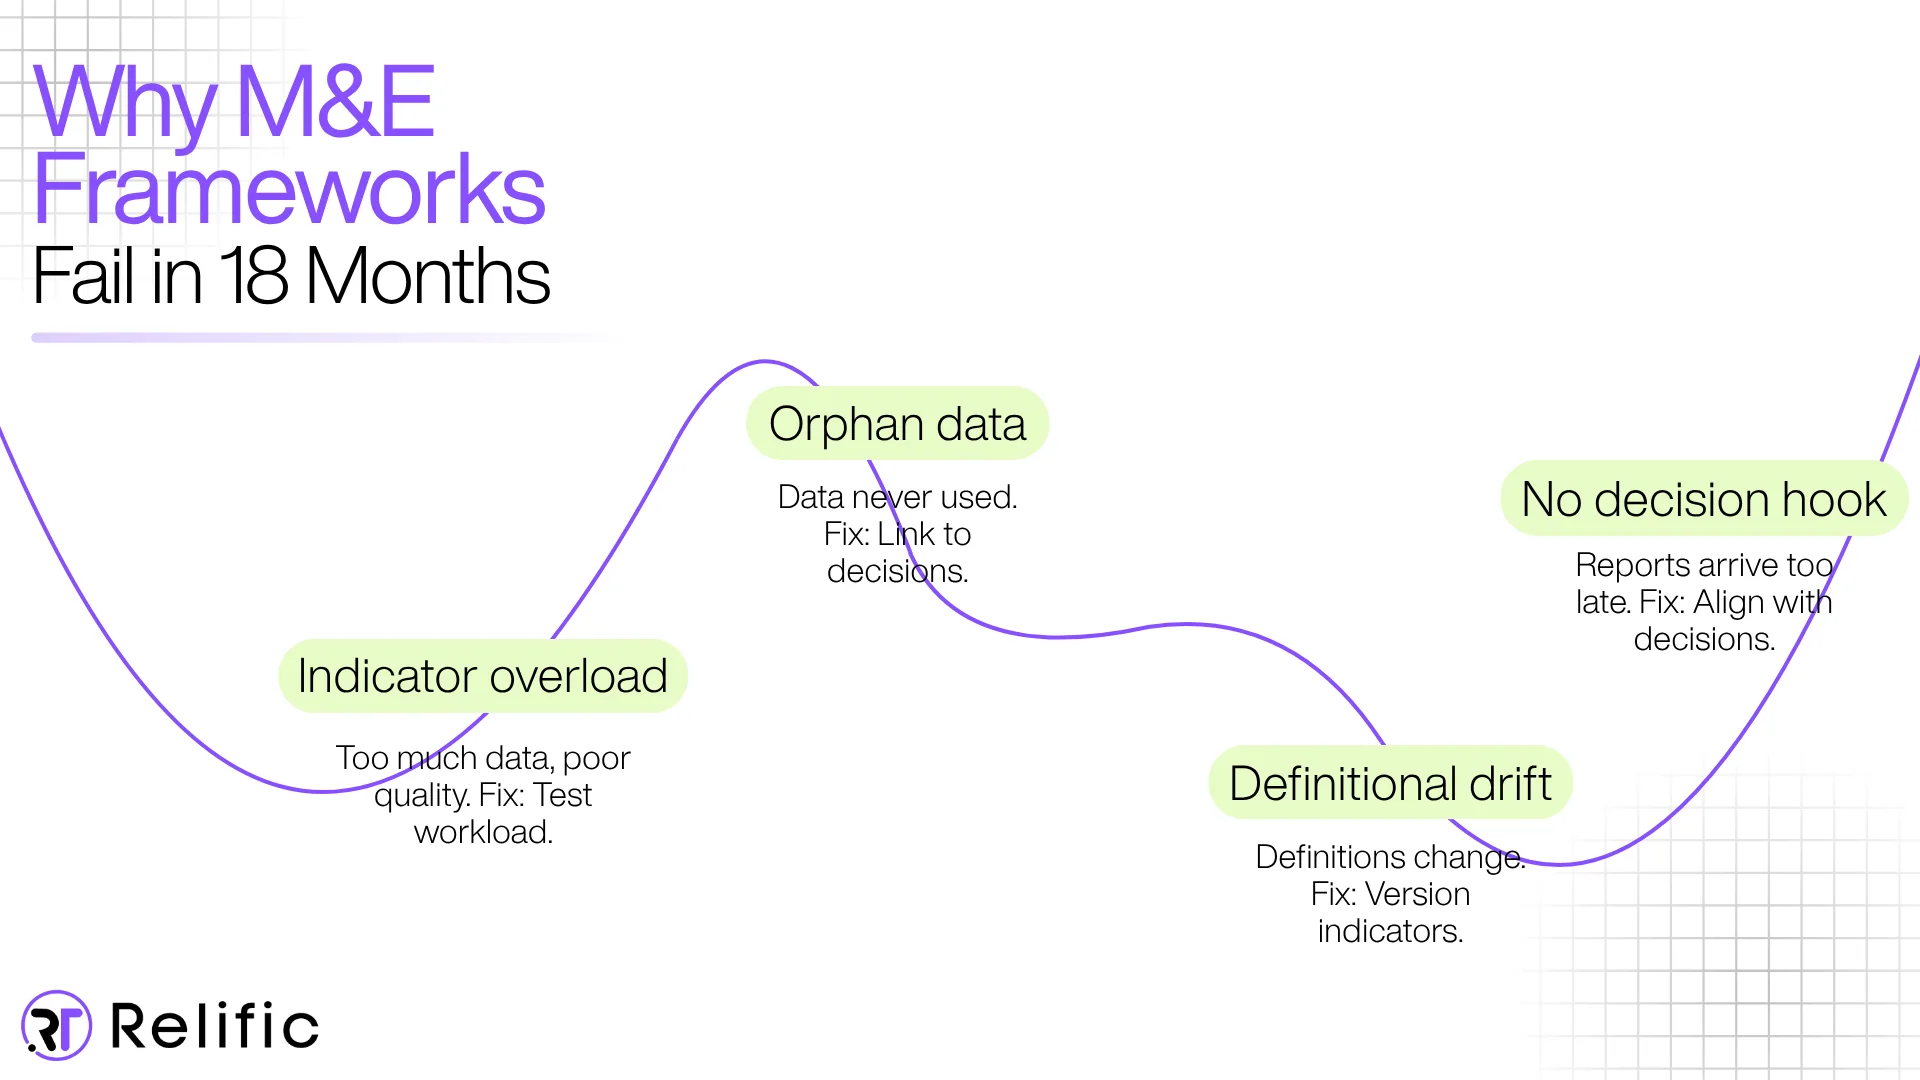
Four failure modes account for most collapsed systems. Each has a specific fix.
- Indicator overload:
The framework demands more data than the team can collect at the required quality. Field staff triage silently; they complete the easy fields, estimate the rest, and nobody finds out until an evaluator back-checks.
Fix: run the load test below before sign-off. - Orphan data:
Data gets collected because a donor asked once, but no internal meeting ever looks at it. Orphan indicators are the largest single source of wasted M&E cost in small and mid-sized NGOs.
Fix: Every indicator names a decision and a decision-maker. - Definitional drift:
"Beneficiary reached" means one thing in one district and something else in the next. Two years later, the trend line is meaningless because the definition moved underneath it.
Fix: a versioned reference sheet per indicator, with a change log. - No decision hook:
The quarterly report arrives after the quarter's budget decisions are made. Evidence that arrives late cannot change anything.
Fix: set the reporting calendar against the decision calendar, not the reverse.
The Decision-First M&E Framework: A Five-Layer Model
Conventional guidance builds forward theory of change, then indicators, then collection, then reporting. That produces comprehensive frameworks that are hard to operate, because nothing ever constrains measurement demand.
This model inverts the sequence. It starts from the decisions the organisation actually makes and lets those decisions limit what gets measured. Treat it as a design discipline rather than a template. The constraint is the point.
Layer 1 Decisions
Before writing a single indicator, list the recurring decisions the programme makes and who makes them. Most programmes have between six and twelve.
| Decision | Owner | Cadence | Evidence needed to make it well |
|---|---|---|---|
| Continue, modify or close a site | Programme Director | Half-yearly | Site-level delivery and outcome movement, cost per participant |
| Reallocate budget between activities | Programme Director + Finance | Quarterly | Burn rate against delivery, underperforming activity lines |
| Change curriculum or delivery model | Technical Lead | Annual | Participant outcomes disaggregated by subgroup, qualitative feedback |
| Escalate a partner performance issue | Partnerships Lead | Quarterly | Partner-reported data with verification status flagged |
| Renew or exit a geography | Board / CEO | Annual | Outcome trend, contribution evidence, external context |
This table becomes the spine. Anything that does not feed one of these rows must justify itself as a donor or statutory requirement, and gets tagged as such so everyone knows why it exists.
Layer 2 Questions
Convert each decision into evaluative questions. This is where the OECD DAC criteria earn their place. The OECD defines relevance, coherence, effectiveness, efficiency, impact, and sustainability as a normative framework for judging the merit of an intervention. Five were adopted in 1991; coherence was added in the December 2019 revision to capture how an intervention interacts with everything else happening around it.
The OECD's own guidance is explicit that the criteria should be applied thoughtfully and adapted to context rather than worked through as a checklist. In practice, that means weighting them by evaluation type:
- Mid-term review: weight relevance, effectiveness, efficiency. The programme is still moving, and these are the criteria you can act on.
- Endline evaluation: add impact and sustainability, which only become measurable late.
- Formative or pilot evaluation: weight relevance and coherence, because the purpose is to fix the design before scale.
Naming the criteria explicitly in terms of reference is also the fastest way to make an evaluation legible to institutional funders, most of whom structure their own assessments this way.
Your Theory of Change is what makes these questions answerable, because it specifies the causal steps evidence has to test. If yours is informal or stale, start with Relific's guide to what a Theory of Change is, with examples and a template; indicators built on a vague theory measure nothing in particular.
Layer 3 Indicators
Now select measures. Each indicator must trace to a question, which traces to a decision.
Distinguish the levels rigorously, because donors and assessors do. Outputs are what your activities produce: sessions delivered, kits distributed. Outcomes are changes in the people or systems you worked with: practice adopted, attendance sustained, income changed. Impact is the longer-term change your programme contributes to but rarely causes alone. Conflating these is the most common single error in NGO reporting, and Relific covers the distinction in outputs vs outcomes vs impact.
Every indicator needs a reference sheet. This is standard institutional practice; USAID called them Performance Indicator Reference Sheets, and it is the highest-return hour of documentation in the entire framework. Ten fields:
- Indicator name and level (output/outcome/impact)
- Precise definition, including what counts and what does not
- Unit of measurement and calculation formula (numerator, denominator)
- Disaggregation required (sex, age band, district, disability, social group)
- Data source and collection instrument
- Collection frequency and responsible role
- Baseline value, date, and how it was established
- Target value and the rationale behind it
- Known limitations and bias risks
- Version number and change log
Field 9 is the one organisations skip and evaluators notice. Stating your own limitations in advance reads as competence, not confession.
The indicator load test
Before signing off an indicator set, do this arithmetic. It takes ten minutes and prevents the most common failure in the sector.
Load test: (indicators requiring primary collection) × (sites) × (respondents per site per round) × (rounds per year) × (minutes per respondent) ÷ 60 = annual interview hours. Multiply by 1.5 to 2.0 for travel, supervision, callbacks, and cleaning. Divide by the field hours you actually have.
Illustrative example. A framework carries 22 indicators, 12 of which need household-level primary collection. The programme covers 40 villages, samples 30 households per village, quarterly, at 18 minutes per interview.
40 × 30 × 4 = 4,800 interviews a year. At 18 minutes each, that is 1,440 hours of pure interview time. Apply a 1.75× multiplier for travel, supervision, callbacks, and cleaning, and you get roughly 2,520 hours, about 1.5 full-time staff doing nothing but collect data, every working day of the year.
If the programme has two field officers who also deliver the sessions, that framework is not under-resourced. It is fictional. The real options are: drop outcome rounds from quarterly to half-yearly, cut the sample, remove indicators that serve no decision, or fund an enumerator. Making that choice deliberately at the design stage is the whole difference between a system that runs and one that quietly degrades.
Layer 4 Instruments and the data spine
The spine is the single structured place where data lands. Its properties matter more than the software brand.
- A persistent participant identifier assigned at first contact. Without one, you can measure averages across shifting groups, but never change in individuals. This single decision determines whether outcome measurement is possible at all.
- Collection that works offline. Rural connectivity is unreliable, and systems requiring a signal produce paper backlogs and retrospective data entry, which is exactly where errors enter.
- Verification metadata captured automatically: timestamp, GPS, enumerator ID, photo where appropriate. These make back-checking cheap.
- Deliberate handling of personal data. Under India's DPDP regime, beneficiary data carries obligations around notice, purpose limitation, consent, and children's data. Framework design is where you decide which fields are genuinely necessary. The cheapest way to protect personal data is not to collect it.
- One source of truth per number. If the donor report and the internal dashboard draw from different files, they will diverge, and reporting weeks get spent reconciling instead of analysing.
Layer 5 Rituals and the reporting crosswalk
A framework produces value only at the moment someone changes a decision because of it. Schedule those moments:
- Monthly: field team data review, 30 minutes completeness, anomalies, immediate corrections.
- Quarterly: programme review against the decision table delivery, reallocation, partner issues, with documented actions and owners.
- Half-yearly: outcome review is the expected change appearing, and where is it not?
- Annually: framework review to retire unused indicators, revisit targets, and update the Theory of Change if reality disagrees with it.
Then build the crosswalk. Most NGOs report to several audiences using different taxonomies, and the instinct is to run parallel measurement systems for each. Resist it. Maintain one indicator spine and map it outward.
| Internal indicator | Donor logframe reference | India CSR (Schedule VII) | SDG alignment | Impact-investor framework |
|---|---|---|---|---|
| % of enrolled girls attending ≥80% of sessions | OP 2.1 attendance rate | Clause (ii) promoting education | SDG 4 | Select the matching IRIS+ education metric from the catalogue |
| % of trained farmers adopting ≥2 practices at 6 months | OC 1.2 practice adoption | Clause (ii) livelihood enhancement / (iv) environmental sustainability | SDG 2 | Select the matching IRIS+ agriculture metric |
| Cost per participant reaching outcome threshold | Efficiency indicator | Supports impact-assessment reporting | — | Efficiency metric for LP reporting |
One collection effort, four report formats. For a multi-donor NGO, this is the single highest-leverage structural decision available, and it is where general-purpose guides consistently stop short.
How To Build An M&E Framework In 90 Days
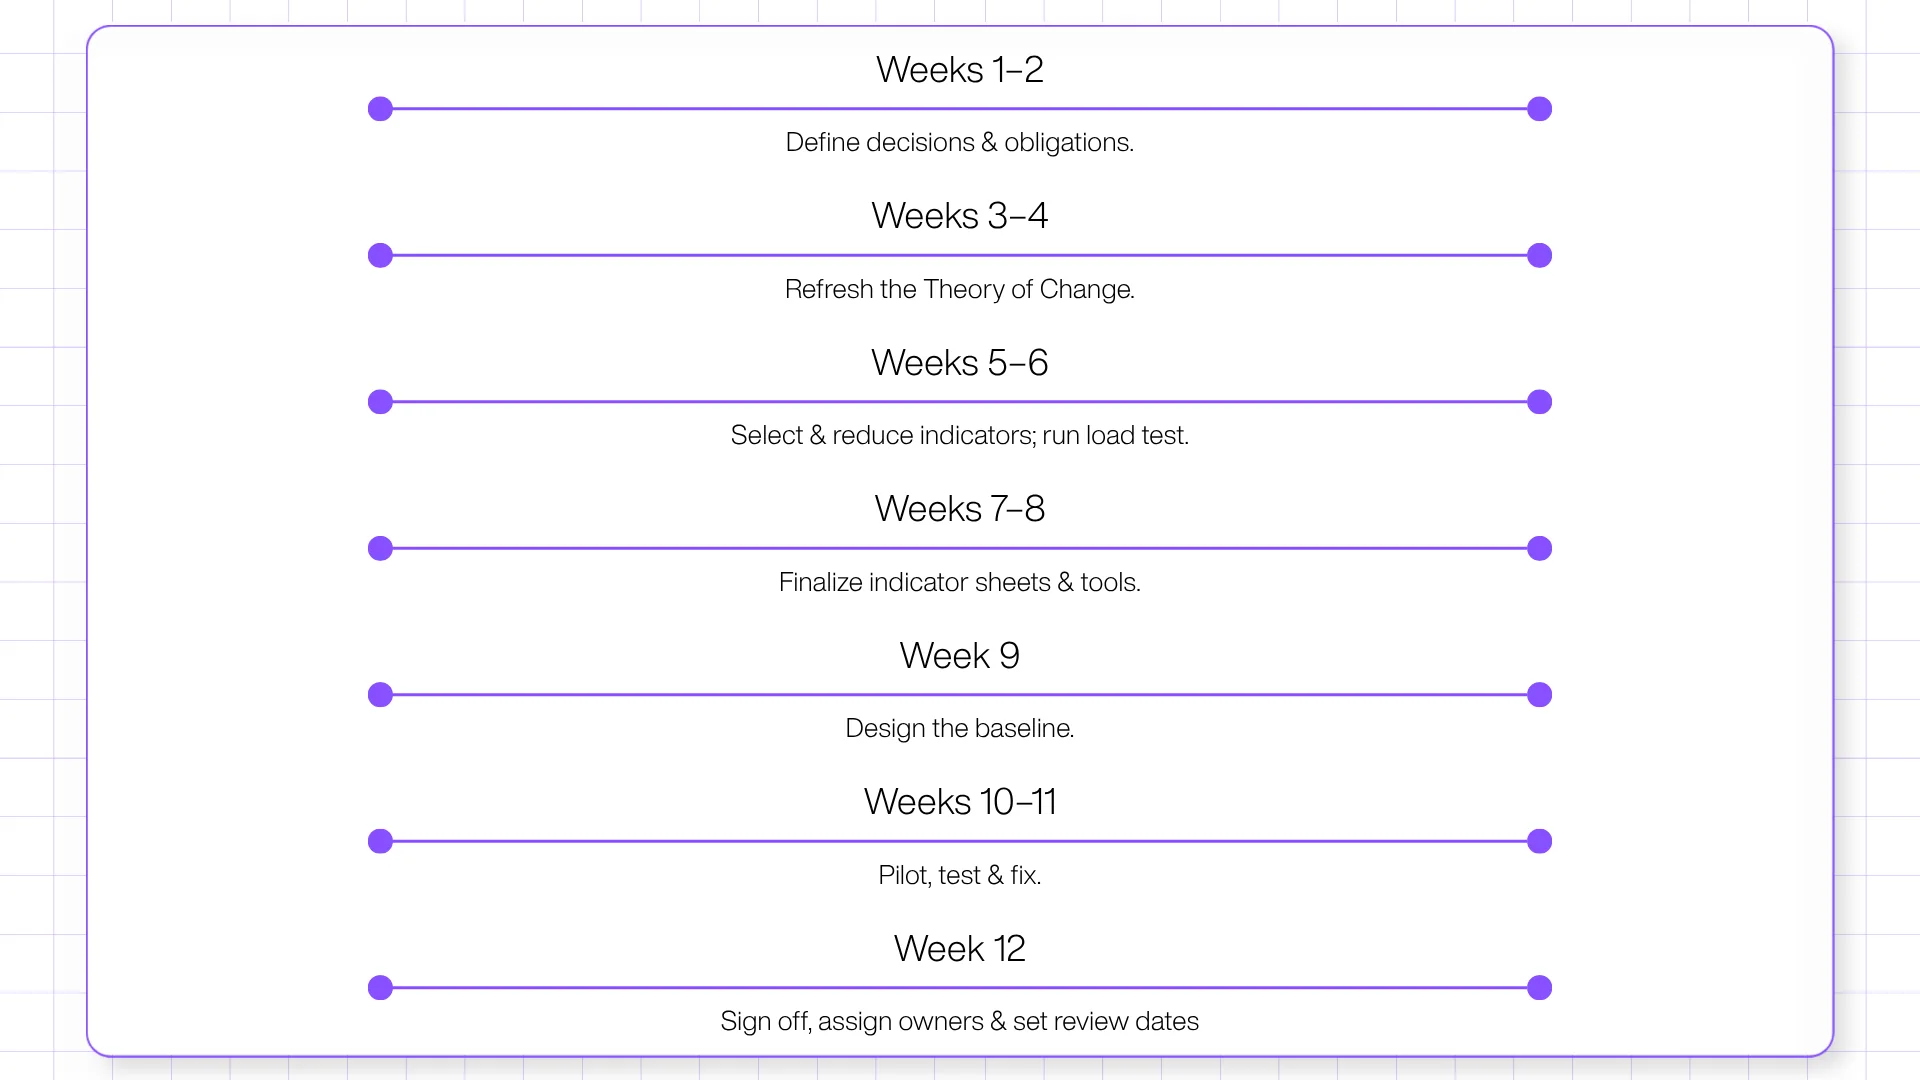
A realistic sequence for a mid-sized NGO with one MEL lead and access to programme staff. Treat the timings as a planning heuristic, not a standard.
Weeks 1–2: Decisions and obligations: Interview programme leads and finance. Build the decision table. Log every external reporting obligation donor, statutory, board with its deadline.
Weeks 3–4: Theory of Change refresh: Test the causal logic against what field staff observe. They will tell you which assumption is wrong if you ask them directly.
Weeks 5–6: Indicator selection: Draft the smallest set that answers the questions. Run the load test. Cut until it passes. Expect to remove 30–50% of the first draft.
Weeks 7–8: Reference sheets and instruments: Write the ten-field sheet for every indicator. Build or adapt the forms. Fix disaggregation now, because retrofitting it means re-collecting.
Week 9: Baseline design: Determine sample, timing, and comparison strategy. If you might ever need to claim attribution, this is the last moment it remains possible.
Weeks 10–11: Pilot: Run the full cycle in two sites. Time the interviews; they always run longer than estimated. Fix skip logic, ambiguous wording, and anything that breaks without a signal.
Week 12: Sign-off and calendar: Lock version 1.0. Publish the review calendar. Assign named owners. Fix the first annual review date before anyone forgets.
A framework that reaches week 12 with fewer indicators than it started with is a healthy framework.
How Many Indicators Should An Ngo Actually Track?
There is no sourced universal answer. The following are our recommended planning heuristics, reflecting what teams can sustain without a dedicated data unit.
| Annual programme budget | Suggested total indicators | Outcome measurement frequency | Realistic M&E staffing | Evaluation approach |
|---|---|---|---|---|
| Under ₹50 lakh | 6–10 | Annual | 0.2 FTE (a programme staffer with protected time) | Internal before-and-after with a documented baseline |
| ₹50 lakh – ₹5 crore | 10–18 | Half-yearly | 0.5–1 FTE MEL officer | Internal endline; external review at close if donor-funded |
| ₹5 crore – ₹25 crore | 18–30 across the portfolio | Half-yearly outcomes, quarterly outputs | 1–2 FTE plus field verification budget | Independent mid-term and endline |
| Above ₹25 crore / multi-state | 12–20 shared portfolio indicators plus project-specific sets | Quarterly outputs, annual outcomes | Dedicated MEL unit | Independent evaluation with comparison design on flagship projects |
Note the pattern in the last row: at portfolio scale the shared indicator count falls rather than rises. Comparability across projects is worth more than completeness within each one.
What Separates A Weak Indicator From A Usable One
| Weak indicator | Why it fails | Stronger version |
|---|---|---|
| Number of beneficiaries reached | "Reached" is undefined; counts a single-event attendee and a full participant identically | Unique individuals (by participant ID) completing at least 4 of 6 sessions, disaggregated by sex and district |
| Improved community awareness | Not measurable; implies no instrument | % of surveyed households correctly identifying 3 of 5 key practices, at baseline and 12 months |
| Number of trainings conducted | Measures effort; can rise while outcomes fall | Trainings conducted (output) and % of trainees demonstrating the practice at 6-month observation (outcome) |
| Farmer income increased | No baseline, no comparison, no timeframe | Median reported net income from the target crop at endline vs baseline, same households, with comparison-group difference reported |
| Satisfaction rate | Ceiling effects; reports 90%+ and rarely moves | % who would recommend the programme, plus open-ended reasons coded and reported quarterly |
Two rules sit inside that table. Keep the output indicator alongside its outcome indicator when outcomes lag; you need to know whether delivery failed or the theory did. And decide disaggregation at design, because a dataset without a sex or district field cannot be split afterwards.
Choosing An Evaluation Design: What You Can Honestly Claim
The most damaging credibility failures in this sector are not fabricated numbers. They are overclaims attributing to a programme a change the design cannot possibly isolate. Match the claim to the design.
The evidence ladder
- Level 0 Activity records: Claim: we delivered this. Nothing further.
- Level 1 Verified outputs: Independently checked delivery records. Claim: this happened, and it has been verified.
- Level 2 Measured change in participants: Baseline and endline on the same individuals. Claim: participants changed over this period. Not: we caused it.
- Level 3 Change relative to a comparison group: Claim: participants changed more than similar non-participants, with stated limitations.
- Level 4 Attributable causal effect: Randomised or robust quasi-experimental design. Claim: the programme caused an effect of this size.
Most NGO reporting sits at Level 1 and is written as though it were at Level 4. Writing at your actual level is a durable trust advantage, particularly with funders whose evaluators will notice the mismatch.
Which design fits which question
| The question you must answer | Design that fits | What it can legitimately claim | Effort and cost |
|---|---|---|---|
| Are we delivering as planned, at quality? | Performance monitoring plus implementation review | Delivery, coverage, fidelity | Built into operations |
| Did participants change over the programme period? | Pre-post measurement on the same participants | Change over time, not causation | Moderate; requires a real baseline |
| Did we cause the change, and how much? | RCT or quasi-experimental (difference-in-differences, propensity score matching, regression discontinuity) | Attributable effect size | High; must be designed before implementation |
| Why did it work, or fail, and for whom? | Process evaluation, realist evaluation, qualitative case studies | Mechanisms and moderating context | Moderate |
| Did we contribute meaningfully in a system with many actors? | Contribution analysis, process tracing, QCA | Plausible, evidenced contribution | Moderate; requires a strong Theory of Change |
| What changed that mattered most to participants? | Most Significant Change, outcome harvesting | Participant-defined outcomes, including unintended ones | Low to moderate |
| What social value was created per rupee invested? | SROI | Monetised value with stated proxies and assumptions | Moderate to high; sensitive to assumptions |
Contribution analysis deserves far more attention than NGOs give it, particularly in systems change, governance and advocacy work where a control group is neither feasible nor ethical. It is a rigorous method, not a consolation prize, but it depends on a Theory of Change explicit enough to be tested step by step.
If monetised valuation is on the agenda, Relific's 2026 guide to measuring social return on investment sets out where SROI adds insight and where the assumptions carry the result.
One further discipline: look for unintended effects on purpose. Serious evaluation treats them as findings. A programme that never reports a negative or unexpected result is usually not looking for one.
Data Quality: The Part Assessors Actually Audit
Framework design decides whether your numbers survive scrutiny. Five standards, set out in USAID's ADS 201 and still the clearest working definition in performance monitoring, apply regardless of which donor you report to:
| Standard | The question it answers | Practical test in your framework |
|---|---|---|
| Validity | Does the data actually represent the result claimed? | Is the indicator a direct measure, or a proxy standing in for something you never measured? |
| Integrity | Are there safeguards against error and manipulation? | Are there transcription checks, edit trails, and separation between the person delivering and the person verifying? |
| Precision | Is the detail sufficient for the decision? | Would a 10% error change the decision this indicator feeds? If so, tighten the method. |
| Reliability | Are collection and analysis methods stable over time? | Has the definition changed mid-programme? Is that change logged? |
| Timeliness | Does data arrive in time to influence decisions? | Does the reporting date precede the decision date, or follow it? |
A verification protocol a small team can actually run:
- Back-check 5% of submissions through an independent staff member within two weeks of collection. Re-ask three verifiable questions.
- Automate what you can. Range checks, mandatory fields, skip logic and duplicate detection remove entire categories of error at source.
- Use timestamp and GPS metadata to spot implausible patterns: twelve interviews in an hour, or every submission from one location.
- Treat partner-reported data as a distinct quality tier and label it as such. If a sub-grantee reported it and you have not verified it, say so. Flagging is cheaper than being caught.
- Reconcile finance and programme data quarterly. Spend that does not match delivery is the earliest reliable signal that something is wrong.
The reporting failures that follow from weak data governance are catalogued in Relific's piece on why CSR reports fail and the ESG data pitfalls behind them.
The India Layer: Compliance That Shapes Your Framework
For NGOs implementing CSR-funded work in India, and for the corporate and foundation partners funding them, an M&E framework is not purely a management tool. It has to produce specific artefacts on statutory timelines.
| Obligation | Who it binds | What your framework must produce |
|---|---|---|
| Section 135, Companies Act 2013 | Companies with net worth ≥ ₹500 crore, turnover ≥ ₹1,000 crore, or net profit ≥ ₹5 crore; spend is 2% of average net profit of the preceding three years | Project-level spend and delivery data mapped to Schedule VII categories, reportable within the corporate reporting cycle |
| Rule 8(3), Companies (CSR Policy) Rules | Companies with average CSR obligation ≥ ₹10 crore over three preceding financial years, for projects with outlay ≥ ₹1 crore completed at least one year earlier | Baseline and outcome data an independent agency can assess; report goes to the Board and is annexed to the annual CSR report |
| Form CSR-1 / Form CSR-2 | Implementing agencies (CSR-1); companies (CSR-2) | Verify registration status of every implementing partner before funds move |
| SEBI Social Stock Exchange framework (circular dated 19 September 2025) | NPOs registered on the SSE | An Annual Impact Report covering at least 67% of the previous year's programme expenditure, filed by 31 October or the income-tax return due date, whichever is later; assessed by an empanelled Social Impact Assessment Organisation for listed projects |
| BRSR and BRSR Core | Top 1,000 listed companies by market capitalisation, under LODR Regulation 34(2)(f); reasonable assurance of BRSR Core phased from the top 150 in FY 2023-24 to the top 1,000 in FY 2026-27 | Social performance data at a quality that will withstand assurance, flowing upward from partner NGOs |
| DPDP Act 2023 and DPDP Rules 2025 | Anyone processing beneficiary personal data | Consent, notice, purpose limitation, minimisation and children's-data protections designed into forms rather than bolted on |
Three timing points worth acting on.
Many pages still state that CSR impact-assessment expenditure is capped at 5% of total CSR spend or ₹50 lakh, whichever is less. That was superseded. Under the amendment notified by the Ministry of Corporate Affairs on 20 September 2022 (G.S.R. 715(E)), a company undertaking impact assessment may book expenditure not exceeding 2% of total CSR expenditure for that financial year or ₹50 lakh, whichever is higher. For large CSR outlays, the ceiling tightened; for smaller obligated companies, the ₹50 lakh floor became more usable. Budgeting against the old rule puts your number wrong in one direction or the other.
BRSR Core assurance reaches the top 1,000 in FY 2026-27: That is the financial year now running. Companies that previously reported social data on their own word are moving into assured disclosure, and the data they assure will include numbers their implementing partners supplied. Expect verification requests to travel down the chain.
DPDP obligations commence in May 2027: MeitY notified the DPDP Rules, 2025 on 13 November 2025, published the following day, with a phased schedule: the Data Protection Board was constituted immediately, consent-manager registration follows at twelve months, and the substantive obligations notice requirements, security safeguards, breach notification, protections for children's data apply from May 2027. For an NGO rebuilding its framework this year, that is a gift of timing. Redesigning forms is the cheap moment to build in consent capture and data minimisation. Retrofitting them across a live dataset is not.
The practical planning implication: if you implement a project likely to cross ₹1 crore for a large corporate funder, an independent assessment is coming roughly a year after completion. Baseline data that does not exist by then cannot be manufactured. Build the baseline into inception, not the closure report.
For the wider picture of how measurement obligations are tightening across Indian funding channels, see Relific's field guide to social impact measurement.
What An M&E Framework Costs, And How To Budget It

Donor guidance converges on a range rather than a number. The Global Fund recommends that grants allocate 5–10% to M&E, including strengthening national data systems. The IFRC's Project/Programme M&E Guide describes an industry norm of 3–10% of overall project budget, with the sensible caveat that the budget should be large enough not to compromise the credibility of results and small enough not to impair the programming itself.
Set against that, the Indian picture is sobering. Across the 531 NSE-listed companies that disclosed project-level detail for FY 2024-25, reported impact-assessment expenditure totalled ₹42.58 crore, and 152 companies accounted for all of it. Fewer than a third of the companies that told us anything about their projects told us they had spent money finding out whether those projects worked.
A realistic cost structure:
| Cost line | Typical share of the M&E budget | Notes |
|---|---|---|
| MEL staff, plus field staff time on collection | 40–60% | The dominant cost in almost every framework |
| Baseline and endline surveys | 15–25% | Lumpy; concentrated at start and close |
| Digital tools and data infrastructure | 5–15% | Falls as a share as programme size grows |
| Training and refreshers for enumerators | 5–10% | Chronically under-budgeted; directly determines data quality |
| Verification and back-checking | 3–7% | The cheapest credibility available |
| External evaluation | Variable | For CSR projects in India, may be partly bookable to CSR within the Rule 8(3) cap |
| Analysis, reporting and dissemination | 5–10% | Includes the time to actually use findings |
Two judgements worth stating plainly. Budget monitoring and evaluation as separate lines, because a single blended line is always consumed by routine monitoring. And if the total allocation falls to the very bottom of the 3–10% range, be honest internally about what it buys: delivery tracking, not evidence. That may be a defensible choice for a small, well-understood intervention. It is not a defensible basis for outcome claims in a funding proposal.
Mistakes To Avoid
- Writing the framework after implementation starts. The baseline is the one thing that cannot be recovered. Design before the first participant enrols.
- Copying a donor's logframe into your internal system. Their taxonomy serves their portfolio. Build your spine, then map outward.
- Measuring what is easy rather than what is decisive. Attendance is easy. Practice change is decisive. Both belong, at different frequencies.
- Skipping the reference sheets. Undefined indicators drift within two reporting cycles, and the drift stays invisible until an evaluator finds it.
- Treating partner-reported data as verified data. Label the tier, verify a sample, disclose the distinction.
- Designing in the MEL team alone. Field staff know which questions respondents will not answer honestly. Ask during design, not after the pilot fails.
- Reporting only positive findings. Evaluators, empanelled assessors and experienced programme officers all read an unblemished report as evidence of weak measurement.
- Confusing a dashboard with a framework. Visualisation is the last mile. A live dashboard built on undefined indicators displays uncertainty faster, not better.
- Never retiring anything. Frameworks accumulate. Every annual review should remove something.
- Ignoring the compliance calendar. A project crossing ₹1 crore for a large corporate funder is on a clock towards independent assessment from the day it starts.
Where Software Fits, And Where It Does Not
Technology cannot repair a framework with no decision hooks. It removes the operational friction that kills otherwise sound frameworks: paper backlogs, retrospective data entry, reconciliation between systems, chasing partners for submissions, and the three-week scramble to assemble a report from files.
The capabilities that matter, roughly in order of impact:
- Offline-first collection that syncs when connectivity returns
- Identifier generation and duplicate detection, so the same person is not counted twice
- Automatic capture of verification metadata: GPS, timestamp, photo, enumerator
- Validation at the point of entry rather than during cleaning
- Indicator definitions held once, centrally, and applied consistently
- Field-level access control and protection of personal data
- One dataset feeding multiple report formats
This is the problem space Relific works in, pairing ProGran for programme and grant operations with Surve-R for field data collection. Several documented capabilities map directly onto the failure modes described above, which is the only reason they are worth naming here.
Against definitional drift, ProGran holds indicator logic centrally: KPIs link to form fields and calculate as submissions arrive, across four KPI types numeric, percentage, milestone, and binary with manual, AI-suggested or fully automatic calculation. Its Theory of Change canvas links activity, output and outcome nodes to both KPIs and budget line items, with a health cascade that flags the connected outcome when an underlying activity goes red. Relific describes this as a live, data-connected version of the logframe most teams keep in a Word document, which is a fair characterisation of the difference.
Against data quality failures, Surve-R applies validation as data is entered rather than after: duplicate-detection rules scoped to a project, cross-submission validation that can flag a child's weight decreasing since the previous visit, calculated fields, and serial-number generation with custom prefixes. ProGran's automation layer adds data quality gates that catch blank fields, impossible values, and duplicates on entry, escalating reminders to partners, and partner scorecards showing who submits on time. Collection runs offline on SQLite with GPS, photo, and signature capture, syncing when the connection returns.
Against the DPDP obligations arriving in 2027, Surve-R auto-detects PII fields, encrypts sensitive fields at rest with AES-256, masks them in dashboards, captures consent, enforces a children's-data gate requiring parental consent, and provides right-to-erasure tooling across forms. Access to PII can be granted for a maximum of 72 hours with mandatory written justification, and every access is logged. Relific states that each organisation runs on an isolated PostgreSQL database, and that it holds ISO/IEC 27001:2022 certification.
Two honest caveats. Relific's product claims here are drawn from its own published documentation rather than independent testing, and any buyer should verify them in a trial against their own forms. And the tool should be chosen after the framework, not before, if you are at the evaluation stage. Relific's guide to what CSR software is and how to choose it makes the point that most rollouts fail on adoption rather than features. The organisations Relific serves span NGOs, CSR teams, foundations and impact investors.
What To Do Next
If you are starting from nothing, do not begin by drafting indicators. Spend the first fortnight building the decision table with your programme and finance leads. That table will cut your indicator set roughly in half before you write a single measure, and the half that survives will be the half someone uses.
If you already have a framework that is not working, run the load test on it this week. The diagnosis is more often arithmetic than conceptual: the framework asks for more data than the team can produce at defensible quality, and the shortfall is being absorbed silently in the field. Fix the arithmetic first, then the design.
And if the binding constraint is operational data arriving late, partners reporting inconsistently, reconciliation eating the reporting cycle, that is where tooling earns its cost. You can book a demo with Relific to see how the programme, collection and compliance layers connect.
Frequently Asked Questions
The framework specifies what will be measured and how each measure is defined, sourced, verified, and used. The plan specifies when and by whom: calendar, sample sizes, budget, staffing, and evaluation timeline. The framework is relatively stable; the plan is updated annually. Donors use the terms interchangeably, so confirm what a specific funder means before submitting.
Six: a results chain linking activities to outputs, outcomes and impact; an indicator set with full definitions; baselines and targets; data sources, instruments and collection frequency; roles and responsibilities including verification; and a use-and-review schedule. Anything less is an indicator list.
Fewer than most frameworks contain. As a planning heuristic, NGOs under ₹50 lakh in annual programme budget operate well with 6–10; mid-sized organisations with 10–18; portfolio-scale organisations with a shared spine of 12–20 plus project-specific measures. The binding constraint is field capacity, which the load test makes visible.
Donor guidance converges on 3–10% of programme budget. The Global Fund recommends 5–10% for its grants; the IFRC's M&E guide cites 3–10% as the working norm. Budget monitoring and evaluation as separate lines, since a blended line is almost always consumed by routine monitoring.
Practically, yes. Indicators selected without an explicit causal argument tend to measure activity rather than change, because no stated mechanism exists to test. The Theory of Change does not need to be elaborate. It needs to be specific enough that someone could disagree with it.
The six OECD DAC criteria relevance, coherence, effectiveness, efficiency, impact and sustainability are the default expectation of most institutional funders. Weight them by evaluation type rather than treating all six equally; the OECD's own guidance cautions against mechanical application.
Not for NGOs directly. The obligation sits with companies. Under Rule 8(3) of the Companies (CSR Policy) Rules, companies with an average CSR obligation of ₹10 crore or more across the three preceding financial years must commission independent impact assessment of projects with outlays of ₹1 crore or more that were completed at least a year earlier. Implementing NGOs supply the underlying data, so the requirement shapes their frameworks in practice. Separately, NPOs registered on the Social Stock Exchange must file an Annual Impact Report covering at least 67% of the prior year's programme expenditure.
Review annually, revise selectively. Change indicator definitions only when necessary, log each change with a version number, and report the break in the series. Frequent redefinition destroys trend data, which is usually the most valuable asset the framework produces.