
Key Takeaways
- A theory of change and an M&E framework are two halves of one system: the causal map and the instrument panel that tests it.
- Assumptions and indicators are the components most often missing from documented theories of change, and they are what connect planning to measurement.
- Three joints hold the system together: node to indicator, indicator to data source, and assumption to monitoring trigger.
- Programme pathways are usually necessary, not sufficient. One failed pathway can stop impact while every other number looks healthy.
- Select indicators after mapping pathways, never from a donor or in-house indicator library, and cut any indicator that informs no decision.
- The OECD-DAC evaluation criteria have numbered six since December 2019, when coherence was added to the original five.
- Outputs count what you delivered. Outcomes measure what changed. Conflating them manufactures a false sense of progress.
Across 62 published studies that used a Theory of Change (ToC) to design or evaluate a public health programme, researchers found that only 15.9% of the documented models actually wrote down their assumptions, and only 9.1% attached indicators. Two of the 62 described using the model during implementation to monitor progress. That systematic review, published in Implementation Science by Breuer and colleagues at the University of Cape Town and the London School of Hygiene and Tropical Medicine, is worth sitting with, because it identifies the failure precisely: the two components most often missing from a theory of change are assumptions and indicators, and those are exactly the two components that connect it to a Monitoring and Evaluation (M&E) framework.
So the problem in most NGOs and foundations is not that nobody built a theory of change. It is that the version sitting in the grant folder was never built to be measured. The M&E team then tracks a different set of numbers in a different file, and by the time anyone compares the two, the reporting year is over.
This guide covers how to build a theory of change that an M&E framework can attach to, where the two systems usually come apart, how to pick indicators that earn their place, and how to keep assumptions under active watch rather than in a footnote.
What Theory Of Change And M&E Framework Do
A theory of change is a documented explanation of how and why a programme is expected to produce a specific long-term change in a specific context. It maps the causal pathway from resources to activities, outputs, outcomes and impact, and it states the assumptions that must hold for each link in that pathway to work.
An M&E framework is the measurement system built on top of that pathway. It specifies what will be measured at each level, how it will be measured, who collects it, how often, and what decisions the resulting data will inform.
The distinction that matters operationally: the theory of change is a claim, and the M&E framework is the test of that claim. A theory of change with no measurement attached is a claim nobody ever checks. An M&E framework with no theory of change behind it produces numbers nobody can interpret, because there is no stated expectation for them to confirm or contradict.
The term itself comes from evaluation practice in the 1990s. The Aspen Institute's Roundtable on Community Change published New Approaches to Evaluating Comprehensive Community Initiatives in 1995, in which Carol Weiss argued that complex programmes are so difficult to evaluate precisely because the assumptions that inspire them are poorly articulated. Thirty years on, that is still the diagnosis. If you need the underlying model first, Relific's explainer on what a theory of change is, with worked examples and a template, covers the building blocks in detail.
Where The Link Between Them Breaks: Three Joints
Research from Johns Hopkins Bloomberg School of Public Health describes the general symptom well: theories of change, indicator lists, and data collection plans become a series of disjointed efforts that do not tie together, turning into exercises done for a donor rather than a logic anyone reasons from.
In practice, that disconnection happens at three identifiable joints. Checking these three is the fastest audit of whether your two documents are actually one system.
Joint 1: Node to indicator:
Every output and outcome node in the pathway should have at least one indicator attached, and every indicator you track should point back to exactly one node. Run the test in both directions. Orphaned nodes mean parts of your theory are untested. Orphaned indicators mean field staff is collecting data that answers no question you asked.
Joint 2: Indicator to data source:
Each indicator needs a named source, a named owner, and a stated frequency. An indicator with no collection method behind it is an intention, not a measurement, and it will quietly go blank for three quarters before anyone notices.
Joint 3: Assumption to monitoring trigger:
This is the joint almost nobody builds. Assumptions sit in a column of the planning document with no way of knowing whether they still hold. When an assumption fails, the first visible sign is usually an outcome indicator collapsing months later, at which point the budget cycle has moved on.
Theory Of Change Vs Logic Model Vs Logframe
These three terms get used interchangeably in proposals, which causes real confusion when a donor asks for one and receives another. They are related tools built at different times for different purposes.
The logframe is the oldest of the three. The Logical Framework Approach was developed in 1969 for the United States Agency for International Development (USAID), with the original matrix prepared by Leon J. Rosenberg and colleagues, and rolled out across 30 country programmes in 1970 and 1971. It was designed to make projects comparable and accountable across a large donor portfolio, which explains both its strengths and its rigidity.
The logic model is the simplest: a linear sequence from inputs to impact, usually drawn as a flow diagram, useful for explaining a programme quickly.
The theory of change emerged later specifically because the first two struggled with complexity, multiple pathways and contextual assumptions.
Logic Model | Logframe | Theory of Change | |
|---|---|---|---|
Form | Linear flow diagram or table | Structured matrix, typically 4x4 | Multi-pathway causal map with narrative |
Primary purpose | Communicating the sequence | Accountability and verification | Explaining and testing how change happens |
Assumptions | Usually absent | Present as a column, rarely monitored | Central, and meant to be tracked |
Flexibility | Moderate | Low once approved by a donor | High, revised as evidence accumulates |
Best used for | Board decks, quick briefings | Donor reporting and contractual milestones | Programme design and strategic decisions |
The practical resolution is not to choose. Build the theory of change as the source document, then derive the logframe or results framework from it when a donor requires that format. Derived views stay consistent with each other. Parallel documents drift within two quarters, and the drift usually surfaces during an evaluation, when the indicators being reported no longer match the outcomes originally promised.
Building A Theory Of Change You Can Actually Measure
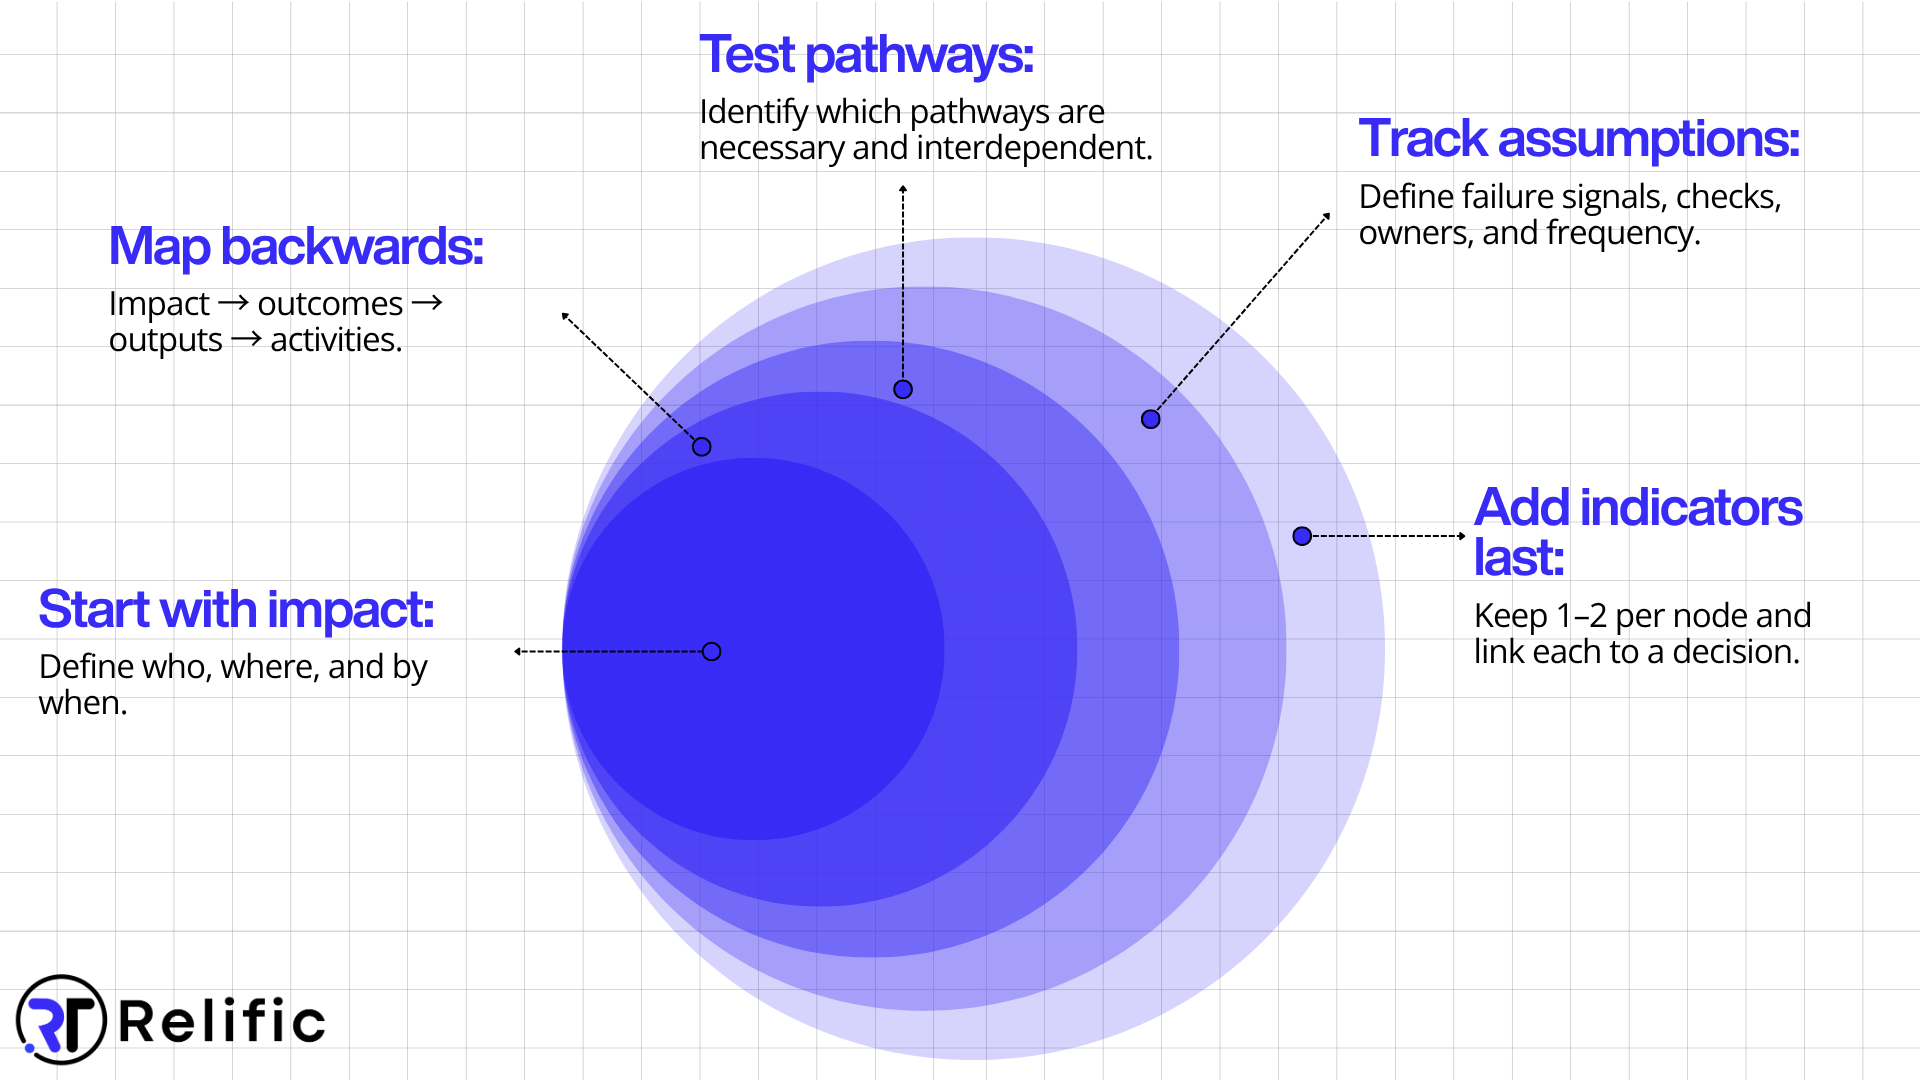
Start at the impact statement and map backwards
Write the long-term change first, with a named population, a geography, and a timeframe. "Improve health outcomes" gives you nothing to work backwards from. "Reduce preventable sanitation-related illness among students in 150 government schools across three districts within three years" forces every subsequent decision to be specific.
Then work backwards. What outcomes must occur for that impact to be plausible? What outputs must exist for those outcomes to occur? What activities and inputs produce those outputs? Backward mapping is not a stylistic preference; it prevents the most common design error, which is starting from the activities a team already runs and reverse-engineering an impact statement that flatters them.
Test each pathway for necessity, not sufficiency
Most real programmes need several pathways working at once. The important insight, and one that competing guides rarely state plainly, is that each pathway is typically necessary but not sufficient. Researchers evaluating global health programmes describe exactly this failure mode: a project can meet several intermediate objectives and still produce no impact because one other objective was not met.
Train health workers to diagnose malaria, and the diagnosis rate rises. If the facilities have no drugs, treatment coverage does not move at all. The training pathway performed. The programme did not.
For each pathway in your model, ask: if this pathway alone succeeds and the others stall, does the outcome still occur? If the answer is no, the pathways are interdependent, and your M&E framework needs to report them together rather than as separate progress lines.
Write assumptions as statements you can check
An assumption belongs in your model only if you can state what would tell you it has failed, and who would notice. Treat the assumption set as a register with the same discipline you would apply to a risk log.
Assumption | Failure signal | Check | Owner | Cadence |
|---|---|---|---|---|
District administration maintains approval for school access | Site visit requests refused or delayed beyond 15 days | Access log from field team | District coordinator | Monthly |
Parents accept the attendance-tracking process | Consent refusals rise above 10% of enrolled households | Consent field in the enrolment form | Field supervisor | Monthly |
Masons and materials remain available locally | Construction milestone slips exceed two weeks | Milestone dates in the works tracker | Infrastructure lead | Fortnightly |
None of these requires a new survey. Each reads a signal from data the programme already generates. That is the standard to aim for: assumptions monitored through existing collection, not through a parallel exercise nobody has time for.
Attach indicators last, and budget them
Indicators should be chosen after the pathways are mapped, not pulled from a donor's preferred list or an in-house indicator library assembled for a previous programme. The Johns Hopkins guidance is direct on this point: choosing indicators first, then fitting them to the model, produces a measurement plan that cannot explain which link in the chain actually broke.
Two rules keep the set lean:
- One indicator per node, two at most. If a node needs three indicators to be legible, the node is probably two nodes.
- The decision test. For each indicator, name the decision it informs and the threshold that would trigger it. "If handwashing compliance stays below 70% for two consecutive months, we reassign two facilitators to the weakest four schools." An indicator with no decision attached is administrative burden on your field team, and it should be cut.
Applying the decision test to an existing framework is uncomfortable and useful. Most organisations discover they can drop between a third and half of what they currently collect without losing any ability to manage the programme.
Building The M&E Framework On Top Of The Theory Of Change
Monitoring is continuous tracking of activities and outputs against plan, using data collected routinely from the field. Evaluation is periodic, deeper assessment of whether outcomes and impact are being achieved and why, usually at midline and endline, and often conducted by an independent agency to protect objectivity.
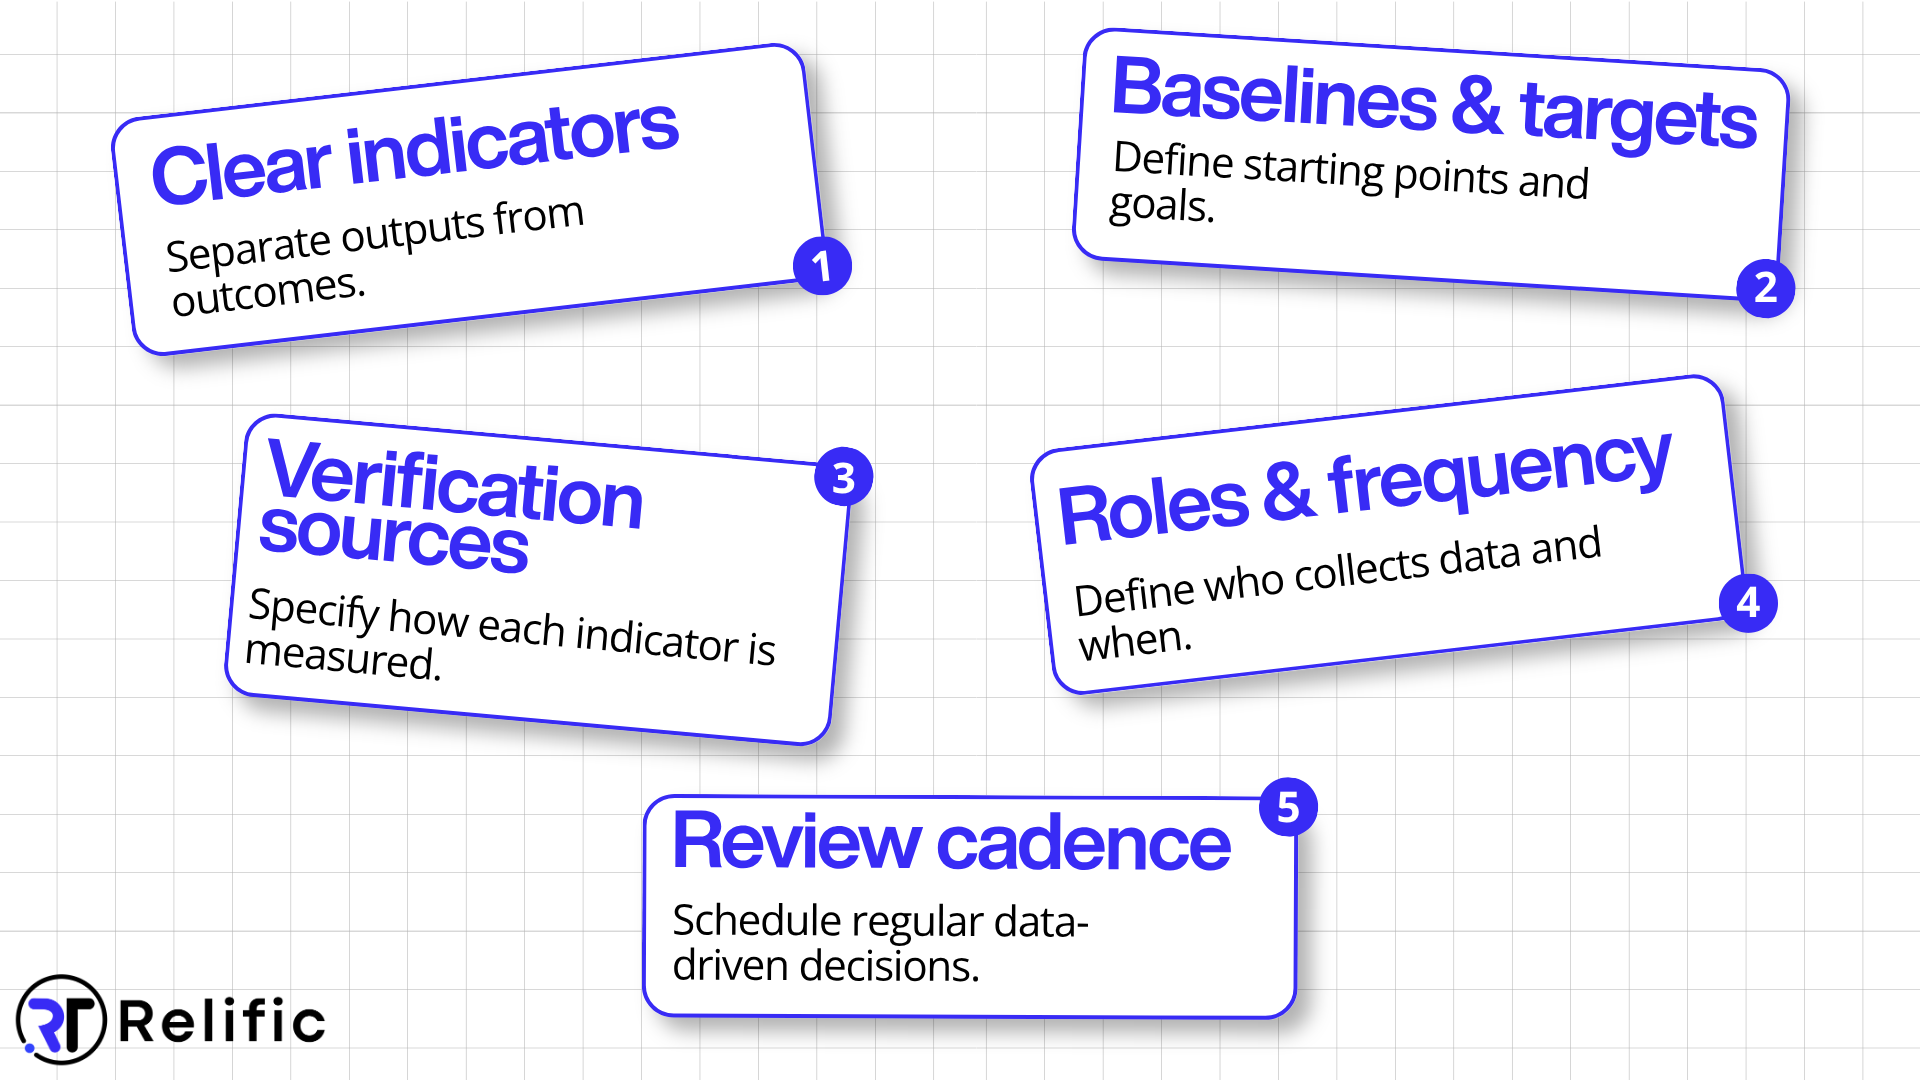
A working framework specifies five things:
- Indicators at each level, distinguishing output indicators you can count directly (people trained, structures completed) from outcome indicators that require assessment (behaviour change, knowledge gain, income shift).
- Baselines and targets for every indicator. Without a documented baseline, you cannot credibly claim change occurred, and the gap surfaces during external evaluation when it is too late to fix.
- Means of verification: the specific source for each indicator, whether that is a household survey, an administrative record, direct observation or a third-party audit.
- Frequency and responsibility: who collects each item, how often, and through which instrument. Ambiguity here is the single largest cause of poor data quality.
- A review cadence: scheduled points at which named people look at the data and make decisions. Data nobody reviews on a schedule is data nobody uses.
Use the six OECD-DAC criteria, not five
Many M&E guides still list five evaluation criteria. That is out of date. The OECD Development Assistance Committee revised its definitions in December 2019 and added coherence to the original set, giving six criteria: relevance, coherence, effectiveness, efficiency, impact and sustainability.
- Relevance: is the intervention doing the right things for this context and population?
- Coherence: how well does it fit with other interventions in the same space, including government schemes and other funders?
- Effectiveness: is it achieving its stated objectives?
- Efficiency: how well are resources being converted into results?
- Impact: what difference does it ultimately make?
- Sustainability: will the benefits continue after the funding ends?
Coherence is the addition most relevant to Indian CSR and foundation programmes, where several funders often work in the same district on overlapping themes, and duplication is common. It is also the criterion most likely to reveal that a programme's assumptions depend on someone else's programme continuing.
One caution from the OECD's own guidance: the criteria are not a checklist to be answered with equal depth. An evaluation that treats all six as equal usually answers none of them well. Mid-term reviews tend to prioritise relevance, effectiveness and efficiency. Endline evaluations add impact and sustainability, because those only become measurable late. The OECD's guidance on applying the criteria thoughtfully sets out the reasoning in full.
A Worked Example: A Wash Programme Across Three Districts
A CSR-funded water, sanitation and hygiene (WASH) programme runs across 150 government schools in three districts. The baseline assessment shows that the absence of functional toilets and handwashing stations is driving absenteeism among adolescent girls.
The theory of change carries three interdependent pathways rather than one chain:
- Infrastructure: construct and commission functional toilets and water points.
- Behaviour change: train teachers, run hygiene sessions, establish daily routines.
- Retention: track attendance, engage parents, follow up on drop-offs.
Indicators attached to the nodes: schools with commissioned WASH infrastructure, teachers trained and assessed, observed handwashing compliance, and girls' attendance rate against the baseline.
Now run it forward. Infrastructure completion reaches 94% of target. Teacher training reaches 100%. Handwashing compliance stalls at 62% against an 80% target.
In two separate documents, this is a single amber number on a spreadsheet, and it gets noted in the quarterly report. In a connected system, the behaviour-change pathway flags as at risk, and because the pathways are marked interdependent, the retention outcome flags with it. The infrastructure numbers are excellent and entirely beside the point: toilets that students do not use in a hygiene routine will not move attendance.
That difference in timing, catching it in week eight rather than at endline, is the entire practical argument for building the two frameworks as one system. The correction available in week eight, reassigning facilitators, is cheap. The correction available at endline is a paragraph explaining what went wrong.
Common Mistakes That Break TOC And M&E Frameworks
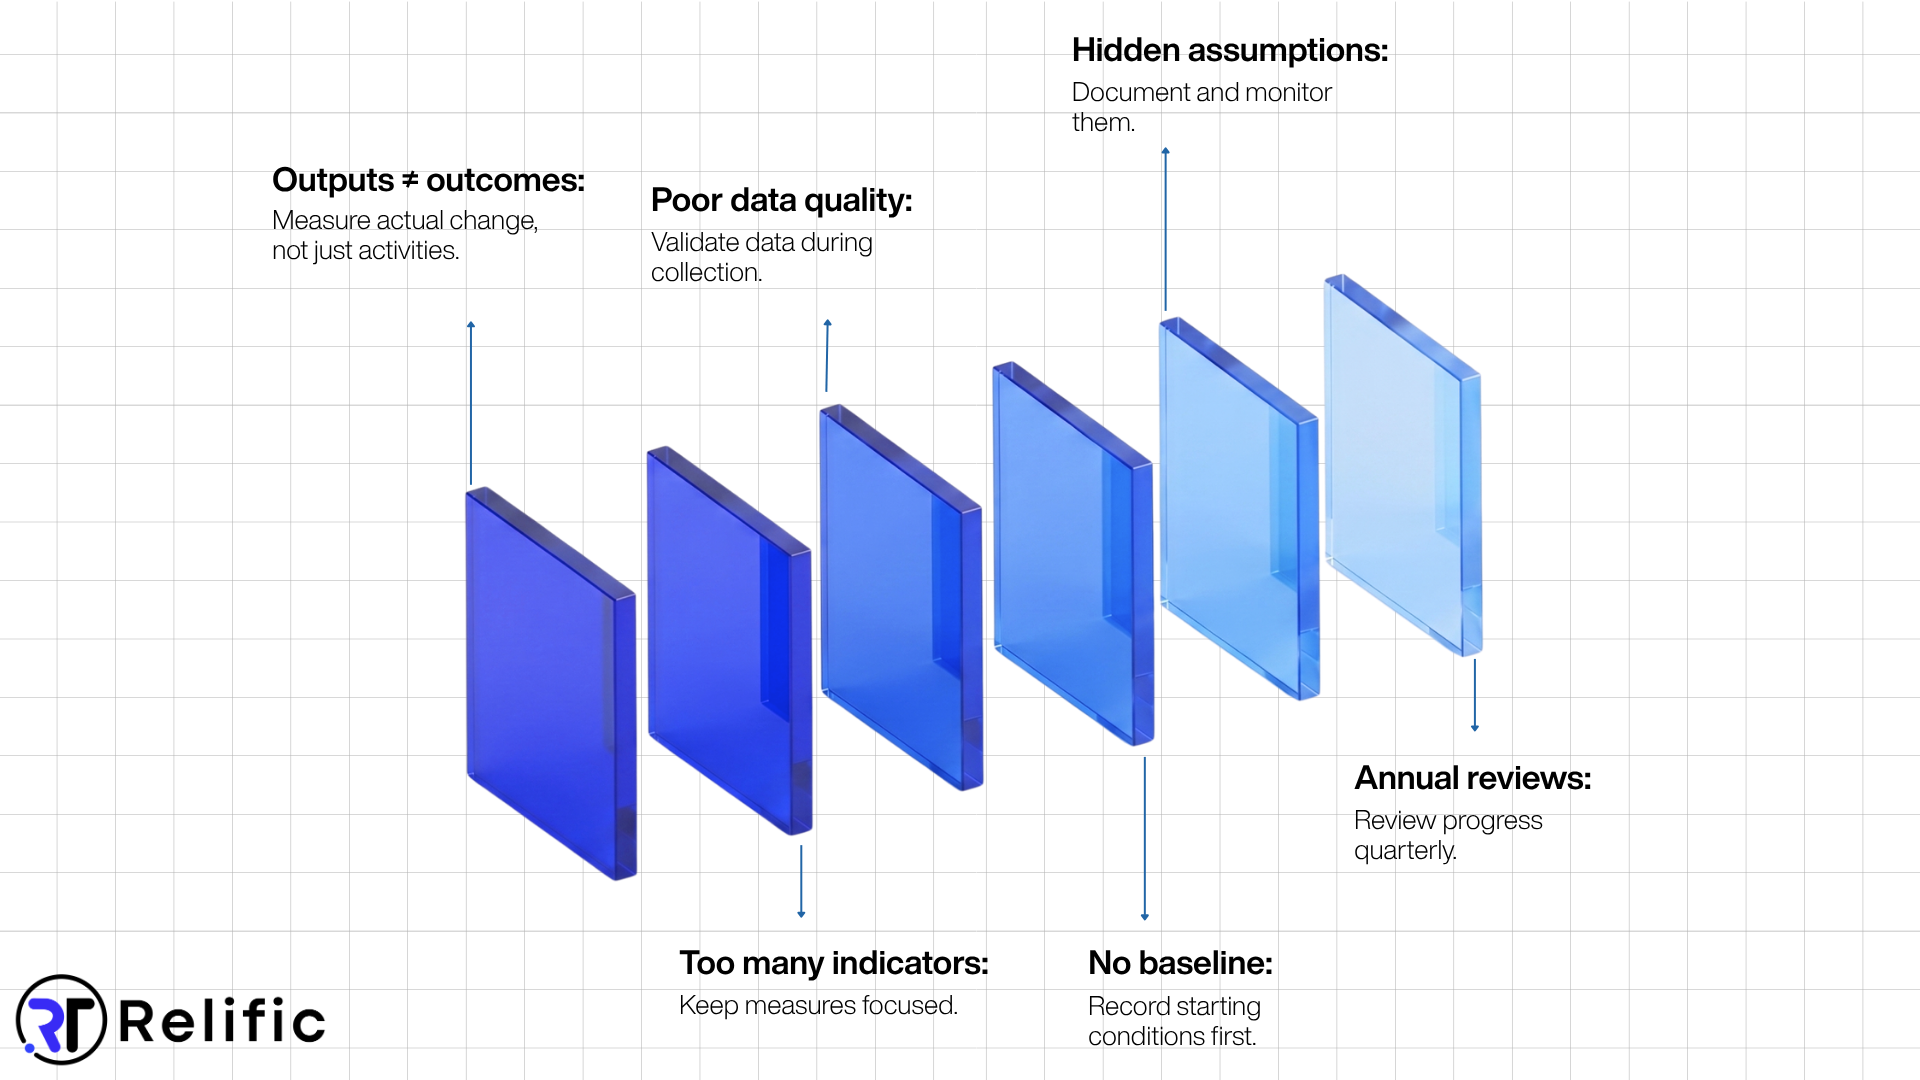
Reporting outputs as outcomes. People trained is an output. Whether their practice changed is the outcome. This conflation is the most damaging single error in social sector reporting because it produces confident progress narratives with no evidence behind them. If you want the vocabulary set out cleanly for a team, Relific's CSR and impact measurement glossary defines the distinctions in one place.
Overloading the indicator set: Measuring everything means measuring nothing well. Long indicator lists degrade data quality at the point of collection, because field officers under time pressure fill in what they can rather than what is accurate.
Leaving data quality to the cleaning stage: Blank fields, impossible values and duplicate entries corrupt the record upstream of any analysis. Validation belongs in the collection instrument, through required fields, range checks and geo-tagging, not in a spreadsheet exercise three weeks later.
No baseline: Without documented starting conditions, no claim of change survives scrutiny. Collect the baseline before the first activity, not retrospectively once the donor asks.
Assumptions left unwritten: Unstated assumptions are the usual reason a well-designed programme underperforms, and an unmonitored assumption is functionally the same as an unwritten one.
Annual-only review: A theory of change revisited once a year at renewal time cannot catch anything early enough to act on. Quarterly is the practical minimum for an active programme.
What Changes When The Theory Of Change Lives In A System
The shift worth making is from the theory of change as a static artefact to the theory of change as the structure your data reports into. When each node in the pathway is linked to the indicator that measures it, and that indicator updates from field submissions rather than manual re-entry, three things change: the lag between a problem occurring and a problem being visible shrinks from months to days, donor reporting becomes an export rather than a reconstruction, and the model gets revised because revising it is easy.
This is the design principle behind ProGran, Relific's programme and grants management product, which provides a visual theory of change canvas where activities, outputs, outcomes and impact are mapped as connected nodes, with multi-pathway support and indicators linked directly to the change framework alongside budget lines. Field data collected through Surve-R's offline-first mobile forms feeds the indicators automatically, which removes the manual reconciliation step where most drift enters. Relific's clients include Tata Trusts, Sehgal Foundation, Kalike, and Rise Against Hunger.
Two honest limits are worth stating. First, software does not fix a weak theory of change; it makes a weak one visible faster, which is useful but not the same thing. If the pathways are wrong, automated indicators will confidently track the wrong things. Second, connected systems pay off in proportion to how much field data you actually collect. A single-site programme with 40 beneficiaries and one coordinator will not see the same return as a multi-district portfolio with 30 field officers, and it is reasonable to run the smaller programme on a well-disciplined spreadsheet until scale justifies the change.
The Compliance Layer For Indian CSR And Foundation Programmes
For CSR-funded programmes in India, part of this work is statutory rather than discretionary.
Under Rule 8(3) of the Companies (Corporate Social Responsibility Policy) Rules, every company with an average CSR obligation of ₹10 crore or more across the three immediately preceding financial years must commission an impact assessment, through an independent agency, of each CSR project with an outlay of ₹1 crore or more that was completed at least one year before the study. The assessment reports go to the Board and are annexed to the annual report on CSR.
One detail that is widely reported incorrectly: the cost cap changed. The Ministry of Corporate Affairs notification dated 20 September 2022 revised the bookable expenditure on impact assessment to 2% of total CSR expenditure for that financial year or ₹50 lakh, whichever is higher. The earlier rule permitted 5% or ₹50 lakh, whichever was less. Sources still quoting the older figure are describing rules that were superseded, and for large CSR portfolios the revised cap is considerably more generous, not less.
The practical implication for framework design: an independent assessor arriving 12 months after project completion will look for baselines, indicator definitions, means of verification and a documented causal logic. Programmes that built those into the theory of change at design stage hand over a package. Programmes that did not spend the assessment window reconstructing evidence, and the reconstruction itself weakens the finding. The same underlying record also supports Schedule VII categorisation and, for the top 1,000 listed companies, Business Responsibility and Sustainability Reporting (BRSR) disclosures. Relific's guide to automated CSR reporting for Indian companies covers the reporting mechanics in more depth.
How Often To Revisit The Theory Of Change
Quarterly is the working minimum for an active programme. At each review, three questions are enough:
- Which indicators moved away from target, and which node do they sit on?
- Which assumptions changed status since the last review?
- Does the model still describe how we now believe change happens here?
Four events should trigger an out-of-cycle revision regardless of the calendar: a partner or government counterpart withdrawing, a funding change that alters scope, an outcome indicator moving in the opposite direction to expectation, and field staff reporting that a pathway does not work the way it was written. That last signal is the most reliable and the most frequently ignored.
The Test Of A Working Framework
There is a simple diagnostic for whether your two documents are one system. Pick any indicator your team reported last quarter and trace it upward: which node does it measure, which outcome does that node feed, and which assumption does the link between them depend on? If you can answer in under a minute, the framework is working. If the trace requires opening three files and asking two colleagues, the theory of change and the M&E framework have separated, and the reporting cycle is where you will find out what that cost.
To see how a connected theory of change canvas, linked indicators and compliance tracking work together on live programme data, book a walkthrough with the Relific team.
Frequently Asked Questions
A theory of change explains how and why a programme is expected to produce change, mapping the causal pathway and the assumptions behind it. An M&E framework specifies how that pathway will be measured: which indicators, from which sources, at what frequency, reviewed by whom. The theory of change is the claim; the M&E framework tests it.
Only if a donor requires it, the efficient approach is to treat the theory of change as the source document and derive the logframe from it, so the two cannot contradict each other. Maintaining both as independent documents creates drift that shows up during evaluation.
Fewer than most frameworks currently carry. Aim for one indicator per output and outcome node, two at most, and cut any indicator that does not inform a specific decision at a specific threshold. Data quality falls as indicator count rises, because collection burden lands on field staff.
Write each assumption with a failure signal, a check that reads from data you already collect, a named owner, and a review cadence. An assumption you cannot state a failure signal for is not specific enough to be useful, and should be rewritten or removed.
Six criteria used to judge development interventions: relevance, coherence, effectiveness, efficiency, impact and sustainability. Coherence was added in the December 2019 revision, which is why older guidance lists five. Evaluations should prioritise a subset rather than covering all six with equal weight.
When collection volume, field team size, or the number of reporting lines makes manual reconciliation the bottleneck. The gain comes from indicators updating directly from field submissions, which removes the re-entry step where errors and delays accumulate. It does not compensate for a poorly designed theory of change.
For companies with an average CSR obligation of ₹10 crore or more over the three preceding financial years, yes; for projects with outlays of ₹1 crore or more completed at least a year earlier, and it must be conducted by an independent agency. Below those thresholds it is voluntary, though funders increasingly expect it.