Executive Summary
- Indian companies are spending nearly ₹35,000 crore on social good every year. That's roughly $2.2 billion. Reliance alone dropped ₹1,592 crore last year. But here's the kicker, most of this money isn't going where you'd think it should.
- The Trend: CSR spending by NSE-listed companies jumped 15.7% to nearly ₹35,000 crore total.
- The Problem: About 60% of this money is going to just 6 wealthy states like Maharashtra and Gujarat, while Aspirational Districts are getting almost nothing.
- The Opportunity: Companies need to move beyond just writing checks. In 2025, building real brand equity means focusing on strategic impact instead of surface-level philanthropy.
1. India's ₹35,000 Crore CSR Problem: Why More Money Doesn't Mean More Impact
India runs one of the world's most ambitious corporate giving experiments. Under Section 135 of the Companies Act, 2013, profitable companies must spend 2% of their profits on social projects, no exceptions, no opt-outs.
On paper, the story looks stellar. Nearly ₹35,000 crore in CSR spend last year, a 15.7% jump. Compliance rates above 98%; NSE-listed companies poured ₹17,967 crore into CSR initiatives, a 15.7% jump from the previous year. That's nearly $2.2 billion in mandatory corporate philanthropy.
But here’s what the headlines miss: ticking the box doesn’t equal changing lives. Compliance is easy. Impact is harder.
1.1 The Compliance Paradox: 98% Success Rate, Zero Trust Gain
Indian companies are brilliant at meeting legal requirements:
- Nearly every eligible company in India ticks the CSR box; 98% of them hit their 2% target or go beyond it.
- Zero improvement in public trust in corporate governance
- Massive geographic inequality in fund distribution
Companies are writing bigger checks, meeting every regulatory requirement, yet public trust hasn’t moved an inch. Why? Because it’s not about how much you spend. It’s about where you spend it, and whether anything truly changes.
1.2 Quick Facts: India's CSR Landscape
Total CSR Spend: ₹17,967 crore ($2.2 billion) Compliance Rate: 98%+ among eligible companies Legal Mandate: 2% of average net profit (3-year average) Get this: 60% of all that money stays in just six states. Six! Aspirational District Coverage: Less than 20% of total spend Year-on-Year Growth: 15.7%
Source: India CSR Outlook Report 2024
1.3 What This Analysis Reveals
This isn’t just another “top spender” list. What matters is:
- Who’s creating real impact
- Why certain sectors dominate
- How legal loopholes reinforce inequality,
- What needs to change if CSR is to fulfil its original promise?
Companies can't just write checks and call it a day anymore. People are watching now, and they want proof.
2. How We Rank India's Top 10 CSR Companies: A 3-Metric Framework
2.1 Why Most CSR Rankings Get It Wrong
Most CSR rankings stop at one metric: spend. Biggest spender equals biggest heart? Not quite. A company can burn ₹500 crore on projects that fade in two years. Another might spend half that and transform 50,000 lives permanently. That’s why we built a different system, one that looks at spend, strategy, and impact together.
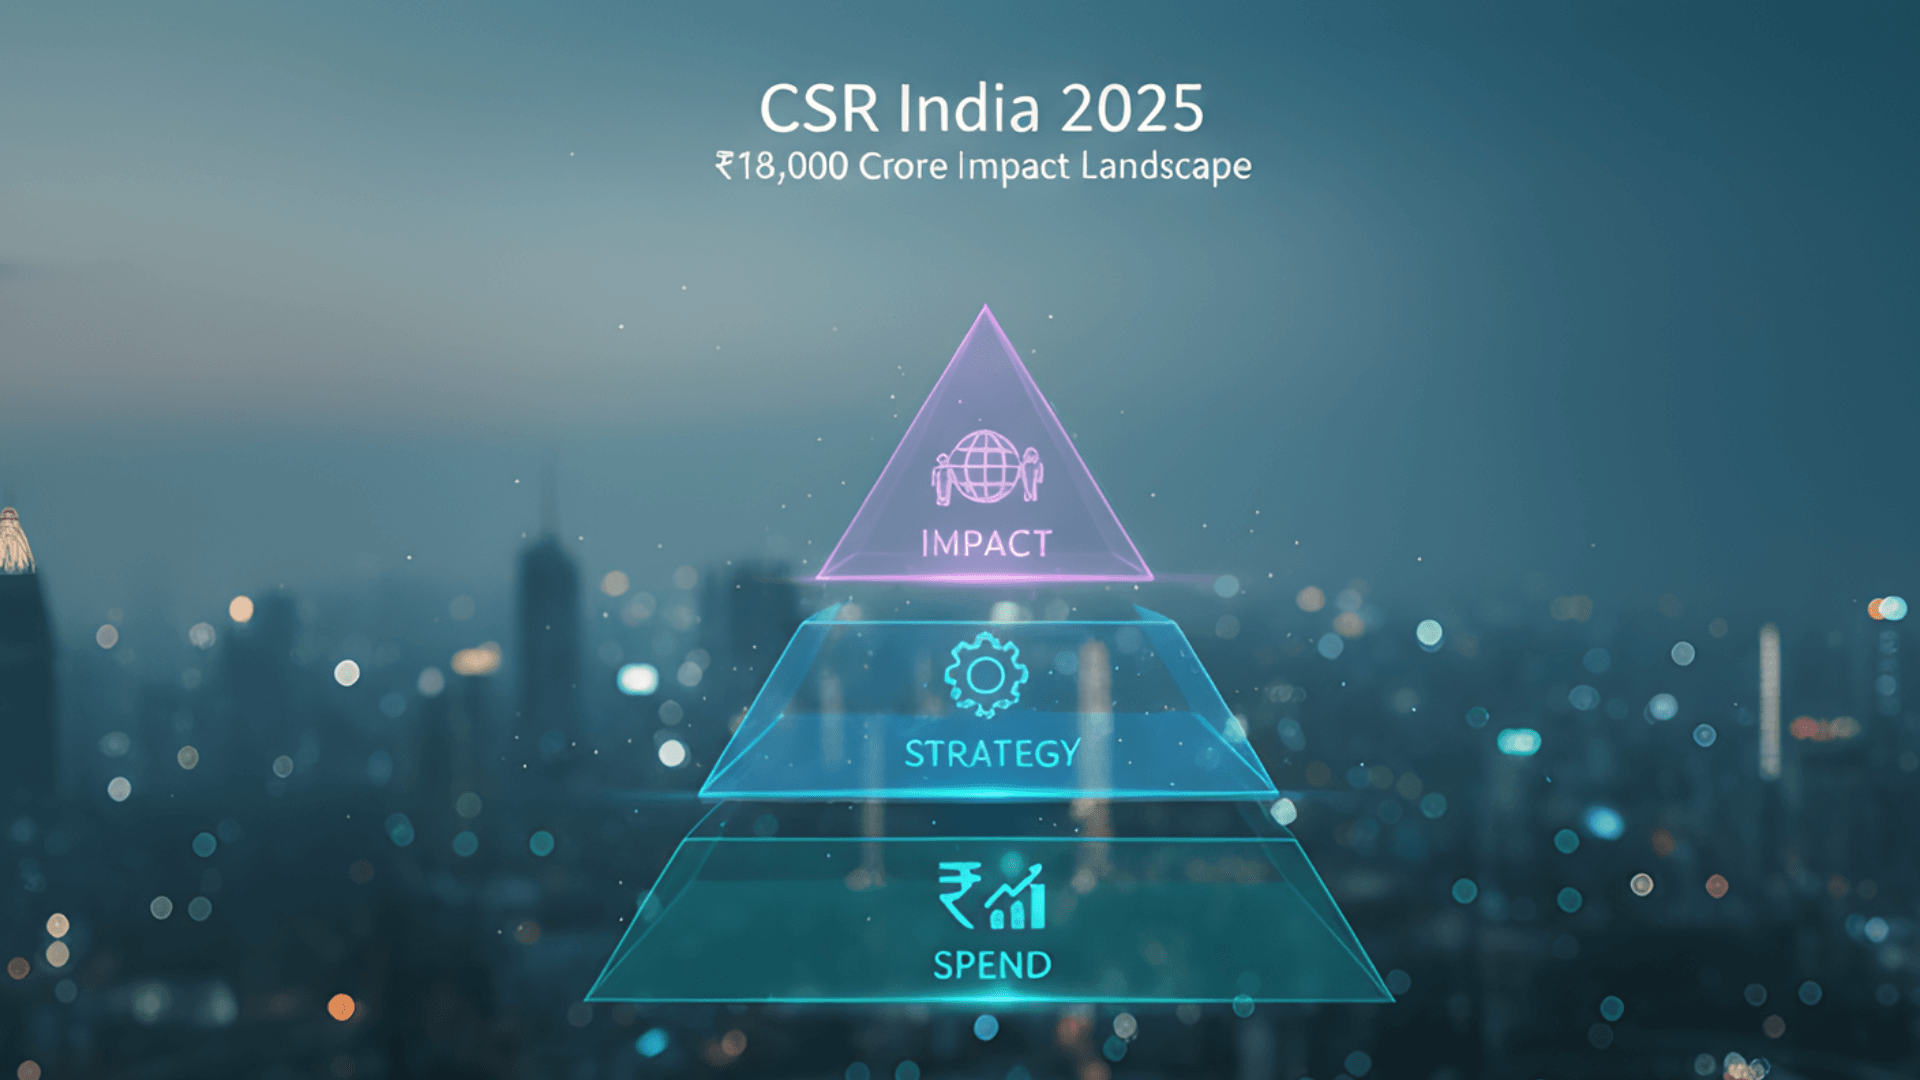
2.2 Our 3-Metric Framework: Spend + Strategy + Impact
To identify companies that are genuinely creating social value, not just meeting legal obligations, we evaluate CSR performance across three dimensions:
1. Magnitude of Spend (30%)
- Verified against mandatory disclosures.
- Scale matters, but spending alone doesn’t make you a leader.
2. Strategic Alignment & Compliance Quality (30%)
- Multi‑year commitments vs. one‑off projects.
- Admin costs under the 5% cap.
- Active CSR committee governance.
- True leaders treat CSR as a strategy, not a checkbox.
3. Verifiable Social Impact (40%)
- Outcomes over inputs.
- Third‑party monitoring and evaluation.
- Focus on systemic issues like malnutrition, education quality, and climate resilience.
- This is where leaders separate from pretenders. Impact is the only metric that truly matters.
3. India's Top 10 CSR Companies Who's Spending Big?
Biggest spender equals biggest leader? Not quite.
We verified the numbers against annual reports filed in mid‑2024 and looked beyond the size of the check. What matters is how companies balance spend, strategy, and impact. Here’s the real “Spend vs. Impact” breakdown.
3.1 Top 10 CSR Companies in India
| Rank | Company | Verified Spend (₹ Cr) | Primary Focus Areas | Key Impact Highlight |
|---|---|---|---|---|
| 1 | Reliance Industries | ₹1,592 | Health, Rural Trans., Sports | Climate Resilience: Supported 3.4M farmers with climate-smart agri-tech. |
| 2 | HDFC Bank | ₹945 | Rural Dev (Parivartan) | Holistic Dev: Covered 85 Aspirational Districts; 10M+ beneficiaries. |
| 3 | TCS | ~₹820 | Digital Literacy, Skilling | Education: Reached 7M+ people; 8.9M employee volunteer hours. |
| 4 | ONGC | ₹634 | Healthcare, Infra (PSU) | Local Impact: Heavy investment in regions near operational drilling sites. |
| 5 | Tata Steel | ₹580 | Tribal Welfare, Health | Maternal Health: MANSI program reduced infant mortality in Jharkhand/Odisha. |
| 6 | ICICI Bank | ₹518 | Skilling, Livelihoods | Skill Training: ICICI Academy trained 100k+ youth for employment. |
| 7 | Infosys | ₹451 | Education, Healthcare | Healthcare: Built a 300-bed hospital block; Aarohan social innovation awards. |
| 8 | IOCL | ₹457.71 | Health, Hygiene, Energy | National Priorities: Supported TB elimination and solar infrastructure. |
| 9 | ITC Limited | ₹404 | Agri, Environment | Sustainability: Water stewardship covering 1.5M acres; solid waste recycling. |
| 10 | Power Grid Corp | ~₹330 | Rural Infra, Health | Infra: Community development near transmission corridors. |
3.2 Analysis of India's Top 10 CSR Companies: What the Data Reveals About Strategic Impact
In the world of CSR, there is a fundamental difference between writing a check and driving a transformation. Writing a check requires liquidity; transformation requires strategy, verifiable outcomes, and the grit to stay the course.
We analyzed the FY 2023-24 disclosures of India’s top spenders through our 3-Metric Framework (Spend 30% + Strategy 30% + Impact 40%). The data tells a fascinating story: the biggest spenders aren't always the most effective change-makers, but when capital meets strategy, the results are systemic.
Here is how the top 10 stack up, not just in rupees, but in reality.
Rank 1: Reliance Industries: ₹1,592 Cr
The Scale Advantage: A National Reach with a Data Dilemma
Reliance operates in a league of its own. Spending nearly 70% more than the runner-up, they have leveraged their massive operational machinery to touch millions. From climate-smart agriculture to grassroots sports, the sheer volume is staggering.
Framework Score Analysis:
-
Magnitude of Spend (30%): ⭐⭐⭐⭐⭐ Exceptional At ₹1,592 Cr, they are the undisputed heavyweight, far exceeding the 2% mandate.
-
Strategic Alignment (30%): ⭐⭐⭐⭐ Strong They play to their strengths: using mobile advisories (Jio integration) to reach farmers and digital platforms to scale women’s empowerment.
-
Verifiable Impact (40%): ⭐⭐⭐ Moderate
The Critical Gap: Reliance reports a cumulative reach of 76 million beneficiaries. While impressive, this number triggers a fundamental measurement question for any auditor: Are we counting touchpoints (people reached once) or lives permanently changed? The lack of granular third-party outcome verification weakens the narrative of deep transformation.
Strategist’s Note: Reliance proves that technology is a force multiplier. However, for practitioners, the lesson is cautionary: Scale creates a verification burden. If you claim to reach 76 million people, your measurement infrastructure must be robust enough to prove distinct outcomes, or you risk credibility gaps.
Rank 2: HDFC Bank: ₹945 Cr
The Integrated Model: Depth Over Breadth
HDFC Bank’s Parivartan is a masterclass in intentional geographic equity. By covering 85 out of 112 Aspirational Districts, they have deliberately chosen to work in the hardest-to-reach regions, rather than picking low-hanging fruit near metros.
Framework Score Analysis:
-
Magnitude of Spend (30%): ⭐⭐⭐⭐⭐ Exceptional Nearly ₹1,000 Cr deployed effectively across 9,000+ villages.
-
Strategic Alignment (30%): ⭐⭐⭐⭐⭐ Exceptional They leverage their greatest asset their branch network, to monitor projects, keeping administrative overheads uniquely low.
-
Verifiable Impact (40%): ⭐⭐⭐⭐⭐ Exceptional
The Secret Sauce: They use a "cascade effect" model. Water conservation leads to better agriculture, which yields higher income, which funds education. This holistic clustering in verified high-need geographies sets the industry benchmark.
Strategist’s Note: HDFC proves that intentionality wins. If you are choosing between shallow reach across the whole country or deep impact in specific clusters, choose depth. Their coverage of 85 Aspirational Districts proves that you can achieve scale and equity if your geographic strategy is deliberate.
Rank 3: TCS: ~₹820 Cr
The Transparency Standard: Where Tech Meets Truth
TCS is the gold standard for impact measurement. They don't just "do good"; they engineer it. By applying the same rigor to CSR as they do to client projects, they have reached 7 million+ beneficiaries with digital literacy programs that are verified, audited, and outcome-focused.
Framework Score Analysis:
-
Magnitude of Spend (30%): ⭐⭐⭐⭐⭐ Exceptional Consistent growth in spending signals that CSR is a board-level priority, not an afterthought.
-
Strategic Alignment (30%): ⭐⭐⭐⭐⭐ Exceptional They deploy their core competency technology via "Learning as a Service" platforms. This makes their programs highly scalable without proportional cost increases.
-
Verifiable Impact (40%): ⭐⭐⭐⭐⭐ Exceptional (Industry Leader) TCS reports verifiable outcomes (e.g., "improved employability") rather than just inputs ("trained X students"). They publish independent audits, turning transparency into a competitive advantage.
Strategist’s Note: TCS differentiates itself through accountability. In a landscape where most reports are filled with fluff, TCS brings data. For practitioners in IT or Finance: Stop writing checks to random NGOs. Deploy your operational capabilities (software, financial literacy, logistics) to solve social problems.
Rank 4: ONGC: ₹634 Cr
The Social License Model: Pragmatism at the Drill Site
For extractive industries, CSR is a survival strategy. ONGC concentrates its heavy spending on healthcare and infrastructure near its drilling sites. This isn't just charity; it's risk management and relationship building.
Framework Score Analysis:
-
Magnitude of Spend (30%): ⭐⭐⭐⭐ Strong
-
Strategic Alignment (30%): ⭐⭐⭐⭐ Strong Investments are geographically tethered to operations, securing the "social license to operate" in resource-rich, often remote regions.
-
Verifiable Impact (40%): ⭐⭐⭐⭐ Strong Direct allocation of ₹81 Cr to Aspirational Districts shows intent. However, public disclosure of third-party outcome verification remains a growth area.
Strategist’s Note: If your business disrupts local communities (mining, energy, heavy manufacturing), your CSR must serve those neighbors first. ONGC demonstrates that localized focus isn't selfish; it's an operational necessity.
Rank 5: Tata Steel: ₹580 Cr
The Long-Term Play: Staying Power in Tribal Belts
While many corporates shy away from tribal regions due to complexity, Tata Steel leans in. Their MANSI program has measurably reduced infant mortality in Jharkhand and Odisha, proving that the hardest geographies often yield the highest marginal impact.
Framework Score Analysis:
-
Magnitude of Spend (30%): ⭐⭐⭐⭐ Strong
-
Strategic Alignment (30%): ⭐⭐⭐⭐⭐ Exceptional Cultural adaptation is key here. They don't import city solutions; they build models (like Sahiyas/ASHAs) that work within tribal social structures.
-
Verifiable Impact (40%): ⭐⭐⭐⭐⭐ Exceptional They track life-and-death metrics (IMR/MMR) over 5+ year cycles. This requires a patience that most quarterly-driven companies lack.
Strategist’s Note: Patience is a strategy. Tata Steel proves that "hard to reach" doesn't mean "impossible to transform." It just means you need a 5-year timeline, not a 1-year timeline.
Rank 6: ICICI Bank: ₹518 Cr
The Employability Pivot: Designing Backwards
ICICI Bank doesn't just "skill" people; they employ them. Their strategy is reverse-engineered: they find out what employers need, and then they design the training.
Framework Score Analysis:
-
Magnitude of Spend (30%): ⭐⭐⭐⭐ Strong A massive 54% jump in spending signals a renewed aggression in their social strategy.
-
Strategic Alignment (30%): ⭐⭐⭐⭐⭐ Exceptional The ICICI Academy is an institutional asset, not a temporary project.
-
Verifiable Impact (40%): ⭐⭐⭐⭐⭐ Exceptional They track placements, not just certificates. 100,000+ youth with jobs is a hard economic metric that is impossible to fake.
Strategist’s Note: Training without placement is just an activity. ICICI proves that outcome-based design (starting with the job offer) is the only way to solve the skills gap.
Rank 7: Infosys: ₹451 Cr
The Ecosystem Builder: The Platform Approach
Infosys combines hard infrastructure (building hospitals) with soft power (innovation awards). Through initiatives like the Aarohan awards, they use their brand to spotlight and scale grassroots changemakers.
Framework Score Analysis:
-
Magnitude of Spend (30%): ⭐⭐⭐⭐ Strong
-
Strategic Alignment (30%): ⭐⭐⭐⭐ Strong They act as a "convener," bringing credibility to smaller social innovators.
-
Verifiable Impact (40%): ⭐⭐⭐⭐ Strong Strong on infrastructure delivery, but the real magic is the multiplier effect of their ecosystem building.
Strategist’s Note: Use your brand. Large companies have convening power that is worth more than their money. By acting as a platform for others, Infosys multiplies its impact beyond its direct spend.
Rank 8: IOCL: ₹457.71 Cr
The Amplifier: Aligning with the State
Indian Oil doesn't try to reinvent the wheel. Instead, they act as a massive amplifier for national priorities like TB elimination and Swachh Bharat.
Framework Score Analysis:
-
Magnitude of Spend (30%): ⭐⭐⭐⭐ Strong
-
Strategic Alignment (30%): ⭐⭐⭐⭐ Strong By plugging into existing government frameworks, they reduce execution friction and setup costs.
-
Verifiable Impact (40%): ⭐⭐⭐ Moderate Great on infrastructure outputs (solar lamps installed), but lighter on beneficiary-level behavioral change data.
Strategist’s Note: Alignment beats innovation when you want speed. Before designing a new program, audit what the government is already doing. If you can add fuel to their fire, you achieve scale much faster.
Rank 9: ITC Limited: ₹404 Cr
The Symbiosis: Embedding CSR in the Supply Chain
ITC is the textbook definition of "Shared Value." Their water stewardship and e-Choupal initiatives aren't charity; they secure the agricultural supply chain that ITC's business depends on.
Framework Score Analysis:
-
Magnitude of Spend (30%): ⭐⭐⭐ Moderate
-
Strategic Alignment (30%): ⭐⭐⭐⭐⭐ Exceptional (Best in Class) This is sustainability-linked CSR. The program's success is tied to business resilience.
-
Verifiable Impact (40%): ⭐⭐⭐⭐⭐ Exceptional 1.5 million acres under water stewardship. They have longitudinal data because they have been doing this for decades.
Strategist’s Note:** Solve your own business problems.** If your CSR strengthens your supply chain, it will never be cut during a downturn. ITC proves that social impact and commercial sense are not mutually exclusive; they are mutually reinforcing.
Rank 10: Power Grid Corporation: ~₹330 Cr
The Focused Operator: Niche is Nice
Power Grid has the smallest budget in the top 10, but they use it surgically. They focus entirely on the communities living under their transmission corridors.
Framework Score Analysis:
-
Magnitude of Spend (30%): ⭐⭐⭐⭐ Strong
-
Strategic Alignment (30%): ⭐⭐⭐⭐ Strong Proximity enables cheap monitoring and high community engagement.
-
Verifiable Impact (40%): ⭐⭐⭐ Moderate Strong localized feedback loops, though wider data publication could be improved.
Strategist’s Note: Don't spread thin. If you have a limited budget, go narrow and deep in the geographies you already understand. Proximity allows for better execution than remote-controlling a national program.
Analyst Note: Reliance tops on spend, but HDFC and ITC often score higher on “depth of impact” because they integrate CSR into long‑term strategy. The framework shows that leaders aren’t just those who spend the most; they’re the ones who align CSR with core strengths and prove measurable outcomes.
4. HDFC Bank vs Reliance: Two Giants, Two Completely Different CSR Strategies
Same budget. Two philosophies. Both spent around ₹900 crore in FY 2023‑24, but the way they deployed it tells us everything about intent.
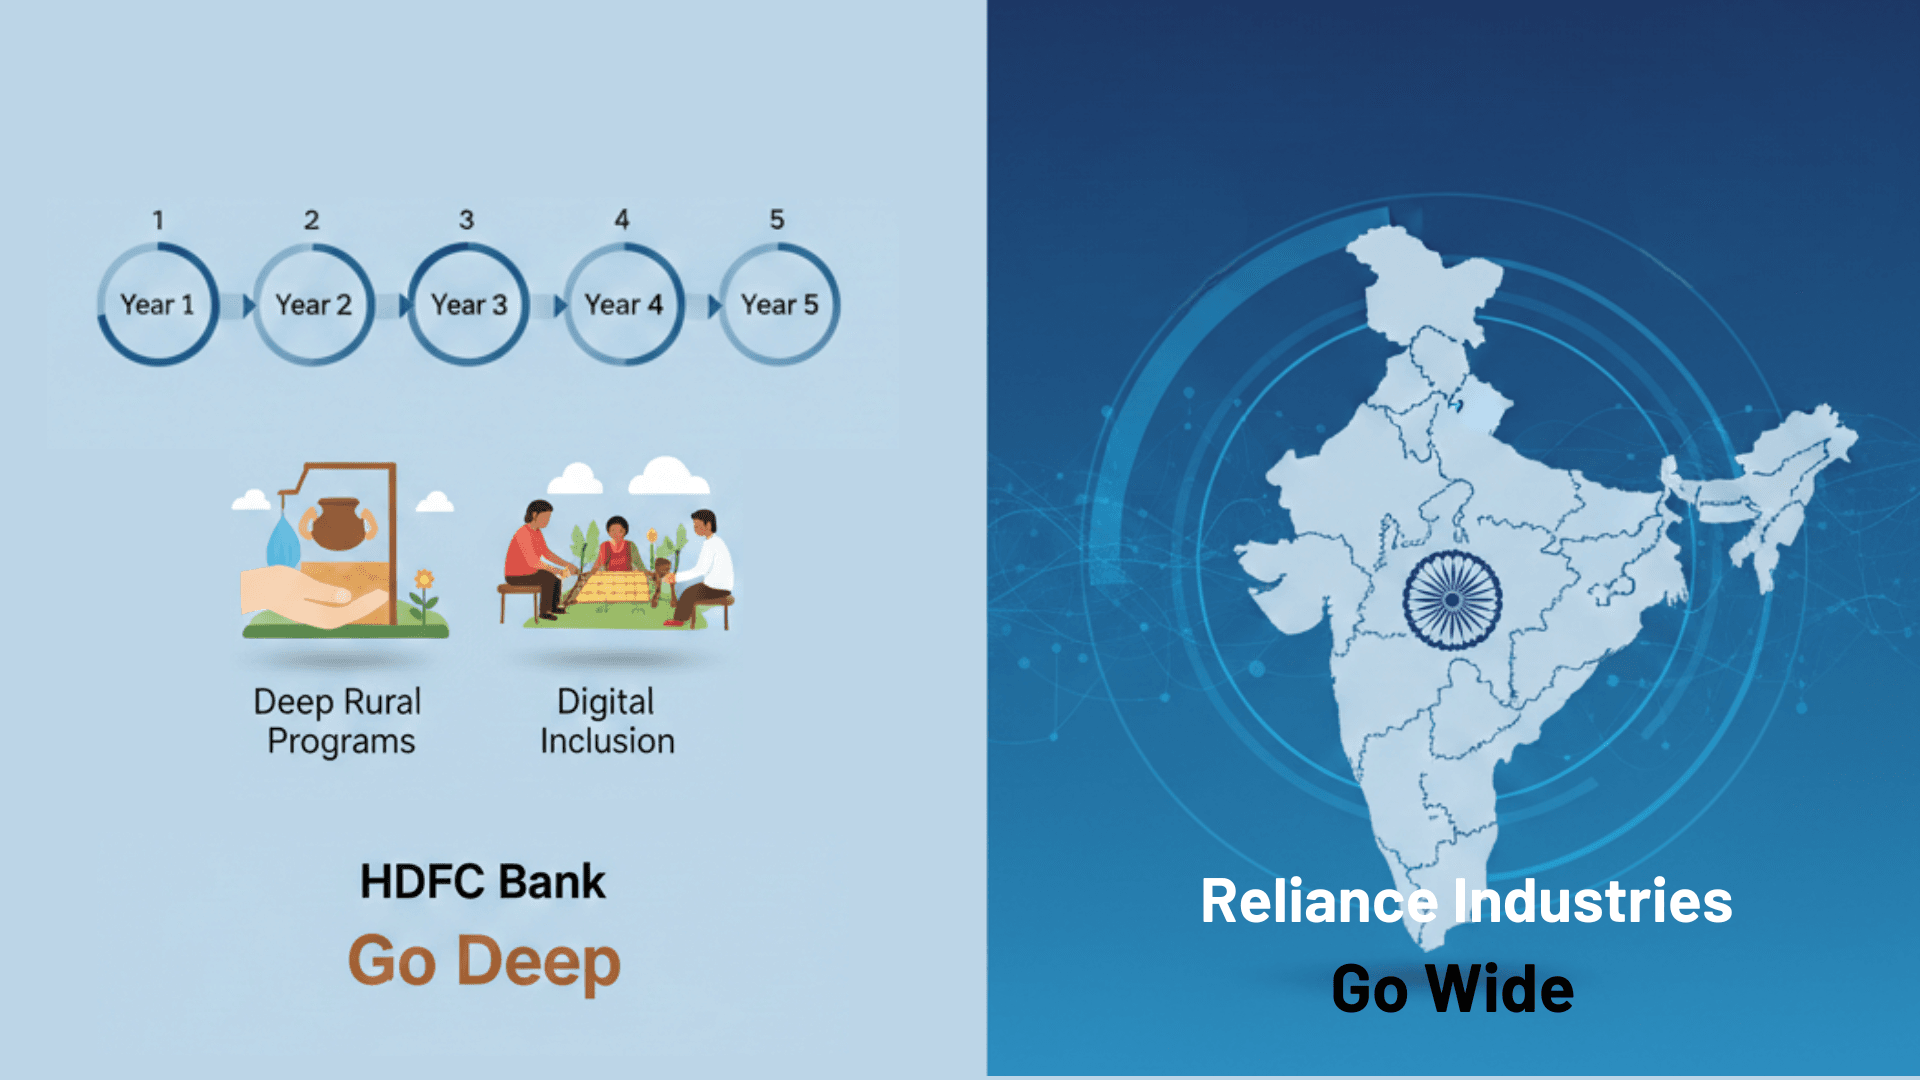
- HDFC’s philosophy: Go deep. Transform village clusters through multi‑year, integrated programs.
- Reliance’s philosophy: Go wide. Build national‑scale, tech‑enabled platforms that touch millions.
Neither is “better.” They’re simply different theories of impact at scale. Here’s how they stack up against the framework:
4.1 HDFC Bank: The Deep Integration Model
- [Spend: ₹945 crore](https://economictimes.indiatimes.com/industry/banking/finance/banking/hdfc-bank-spends-rs-945-crore-on-csr-impacts-10-19-crore-lives/articleshow/111869840.cms) - consistent, top‑tier allocation.
- Strategy: Parivartan (Holistic Rural Development Programme). Multi‑year commitments across 5 pillars: water, livelihoods, education, health, and financial literacy.
- Impact: 10.19 crore lives touched, 9,000+ villages, 85 of India’s 112 Aspirational Districts.
Why it works: One intervention triggers ripple effects. Water conservation boosts agriculture, which raises incomes, which fuels financial literacy, which funds education, which creates skilled youth, stabilising village economies.
Weakness: Slow to scale. Deep integration requires patience and multi‑year commitments.
4.2 Reliance Foundation: The National Platform Model
- Spend: ₹1,592 crore - comparable to HDFC.
- Strategy: Replicable, tech‑enabled programs designed for national scale. Three pillars: Climate‑Smart Agriculture (BIJ): Real‑time advisories to 3.4M farmers, millet promotion. Women’s Empowerment: Digital literacy, financial inclusion, livelihood training. Sports for Development: 23M children reached, grassroots infrastructure for Olympic talent.
- Impact: 76M cumulative beneficiaries across 5,000+ villages.
Why it works: Technology acts as a force multiplier. Apps, digital literacy, and scalable platforms extend reach instantly.
Weakness: Impact verification opacity. Limited third‑party monitoring makes it hard to prove whether 76M beneficiaries saw lasting change or one‑time touchpoints.
4.3 The Verdict: Which Model Should You Follow?
- Deep, lasting transformation: HDFC’s cluster approach.
- National‑scale reach: Reliance’s platform approach.
- Geographic equity: HDFC (85 Aspirational Districts).
- Climate resilience integration: Reliance (BIJ program).
- Transparency: HDFC and TCS lead; Reliance lags.
Lesson for executives: Scale isn’t about money. It’s about strategy. Both models prove you can deploy ₹900 crore in radically different ways and succeed, if you’re intentional about your design.
4.4 Key Takeaways for Any CSR Budget
- Integrate, don’t isolate: HDFC’s 5‑pillar model beats fragmented projects.
- Leverage your core strength: Banks → financial literacy; Tech → digital education.
- Use technology to scale: Reliance’s farmer app reached 3.4M instantly.
- Commit long‑term: Multi‑year programs outperform annual one‑offs.
- Align with national priorities: Aspirational Districts + climate resilience = impact + credibility.
5 The Big Three: Who Dominates India's CSR Spending?
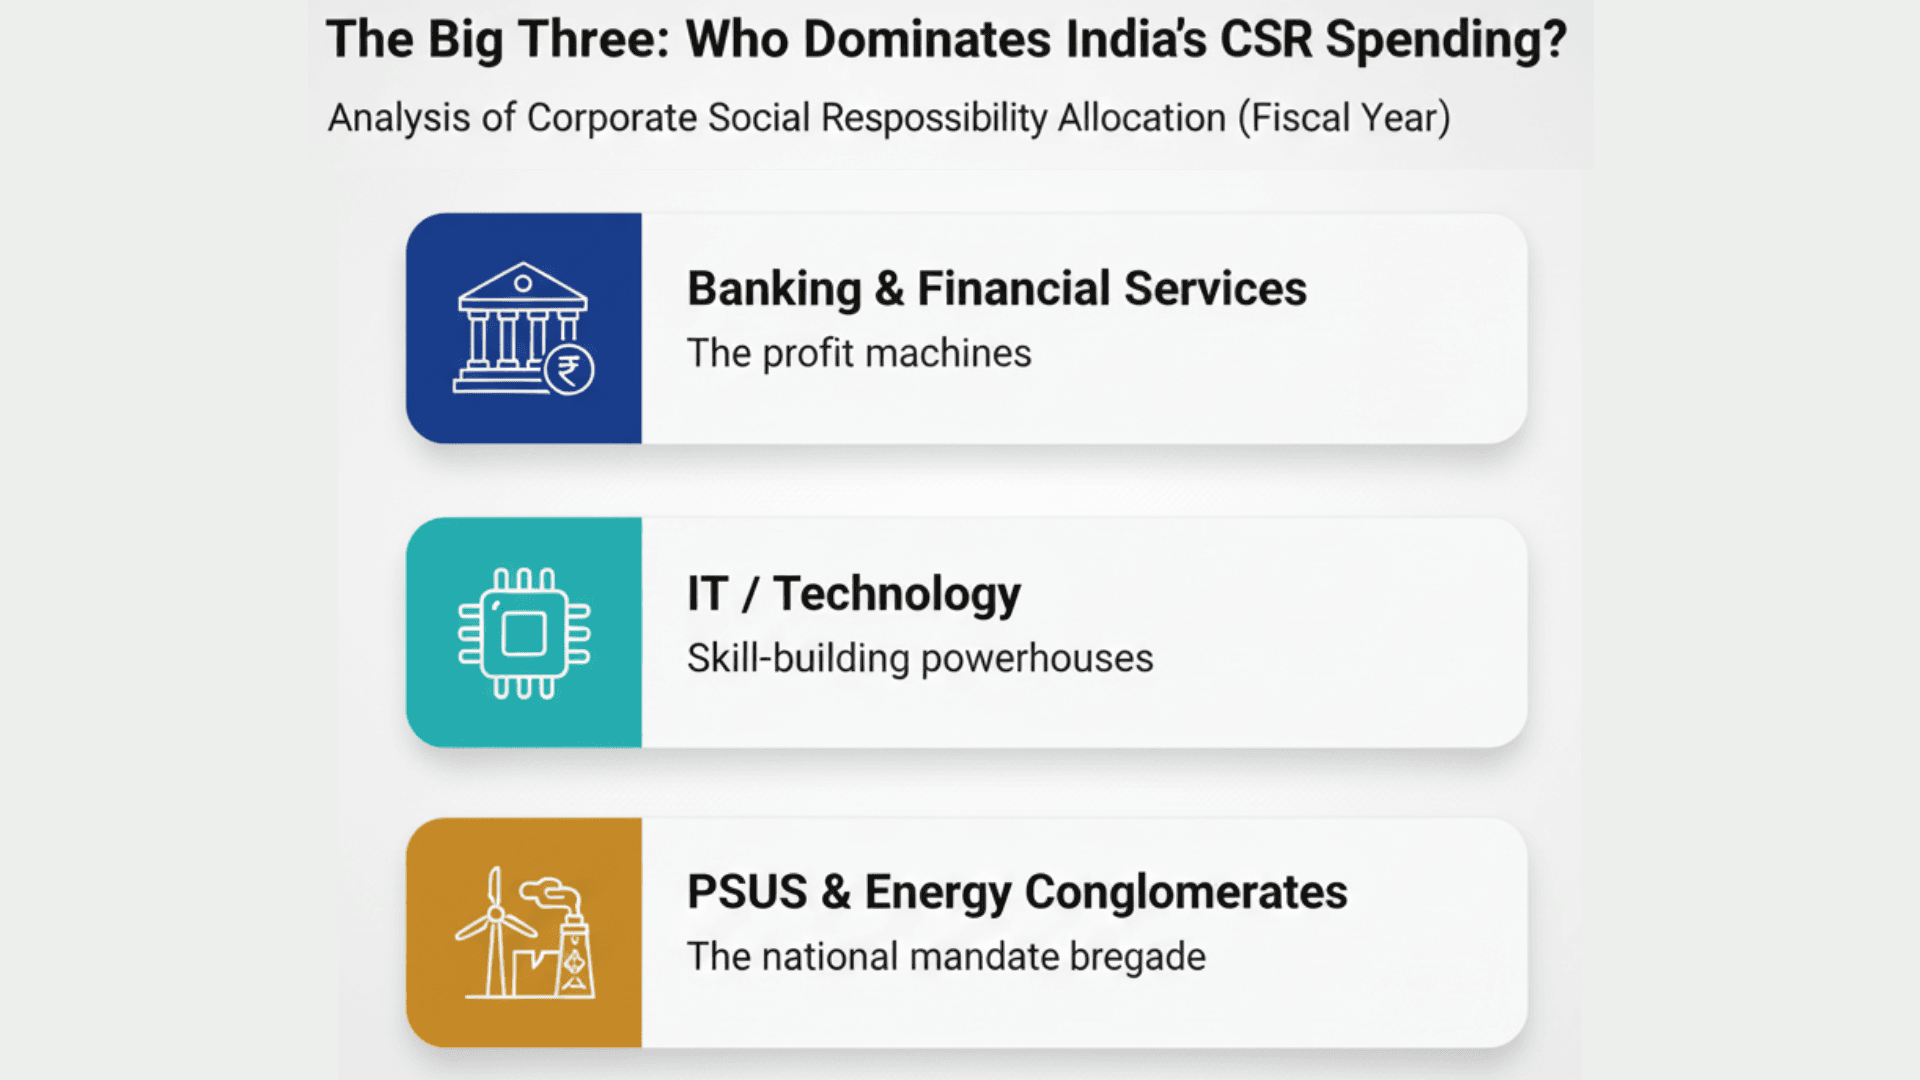
When you map these 10 companies by sector, a clear pattern jumps out. Three industry groups control the lion’s share of India’s CSR funding, and each tells us something about how corporate India thinks about responsibility.
5.1. Banking & Financial Services: The Profit Machines
Key Players: HDFC Bank (₹945 crore), ICICI Bank (₹519 crore)
Banks dominate because profits translate directly into CSR obligations. Unlike manufacturers tied to specific plants, banks operate everywhere, giving them flexibility in project design
What they fund: Large‑scale rural development, financial literacy, skill training. HDFC’s HRDP model is the gold standard five integrated pillars deployed across 85 Aspirational Districts.
The edge: Banks can leverage their branch networks to identify high‑need communities and monitor projects. That’s why HDFC’s coverage of 85 Aspirational Districts isn’t just impressive, it’s proof of intent.
5.2. IT & Technology Services: Skill-Building Powerhouses
Key Players: TCS (₹827 crore), Infosys (₹456 crore)
Tech companies bring massive margins and a natural advantage: they can deploy their core competency technology for social good.
What they fund: Digital literacy, coding bootcamps, scalable education platforms. TCS’s “Learning as a Service” has empowered 7M+ people, backed by 8.9M employee volunteer hours.
The edge: Scale and transparency. TCS publishes third‑party verified outcomes, setting a benchmark for impact reporting.
The challenge: Risk of exclusion. If programs cluster in semi‑urban areas with internet access, the most marginalised remain invisible.
5.3. PSUs & Energy Conglomerates: The National Mandate Brigade
Key Players: RIL (₹900 crore), ONGC (₹635 crore), IOC (₹458 crore), Power Grid (₹330 crore)
Public Sector Undertakings (PSUs) operate under explicit government directives to align CSR with national priorities. Private giants like Reliance mirror this scale with their own foundations.
What they fund: Energy access, healthcare infrastructure, climate resilience, and community development near operational sites.
The PSU difference: ONGC spent ₹81 crore directly in Aspirational Districts, a deliberate move to balance compliance with social license to operate.
Reliance's scale: With 76M cumulative beneficiaries, Reliance Foundation runs almost like a parallel development agency, from grassroots sports to climate‑smart agriculture.
5.4 What This Ranking Reveals (And What It Hides)
5.4.1 The Encouraging Signs
- ✅ High compliance: India’s largest companies consistently meet or exceed the 2% mandate.
- ✅ Sectoral alignment: (banks → financial inclusion, IT → digital literacy)
- ✅ Scale potential: ₹6,000+ crore from just 10 companies creates a powerful funding base.
5.4.2 The Warning Flags
- ⚠️ Geographic concentration: Most money stays in already‑developed states.
- ⚠️ Impact opacity: Only a handful of companies (HDFC, TCS, RIL) publish detailed, third-party verified impact data
- ⚠️ Safe bets: 73% of CSR spend flows into “safe” sectors like education and healthcare.
5.5 The Real Test: Compliance vs. Consequence
Every company here is legally compliant. Boxes ticked. Reports filed. Glossy photos published.
But compliance isn’t a consequence.
- HDFC Bank reached 85 of 112 Aspirational Districts. Most peers? Barely 20.
- TCS publishes independent M&E reports. Others hide behind vague narratives.
- Reliance Foundation tracks 76M beneficiaries. Few can prove if last year’s “beneficiaries” are still benefiting today.
The uncomfortable truth: CSR in India is still more about compliance than transformation. The leaders will be those who prove consequence, not just spend.
5.6 Quick Comparison: Top 3 CSR Spenders at a Glance
| Metric | HDFC Bank | Reliance Industries | TCS |
|---|---|---|---|
| FY 23–24 Spend | ₹945 crore | ₹900 crore | ₹827 crore |
| Beneficiary Reach | 10.19 crore lives | 7.6 crore cumulative | 7 million+ |
| Aspirational District Coverage | 85/112 districts | National programs | Data not disclosed |
| Core Strength Deployed | Banking network | Foundation scale | Technology platforms |
| Impact Verification | Disclosed in annual reports | Foundation reports available | Third-party M&E published |
| Strategic Focus | Integrated village development | Climate + rural resilience | Digital literacy + skills |
- Winner in impact transparency: TCS (publishes independent M&E)
- Winner in geographic equity: HDFC Bank (85 Aspirational Districts)
- Winner in scale: Reliance Foundation (76M beneficiaries)
6. Where CSR Money Actually Goes: Schedule VII Spending Breakdown
Here’s the uncomfortable truth: India’s CSR machine is bigger than ever ₹34,908 crore deployed across 27,000+ companies. But when you look at where the money actually flows, the picture is less inspiring
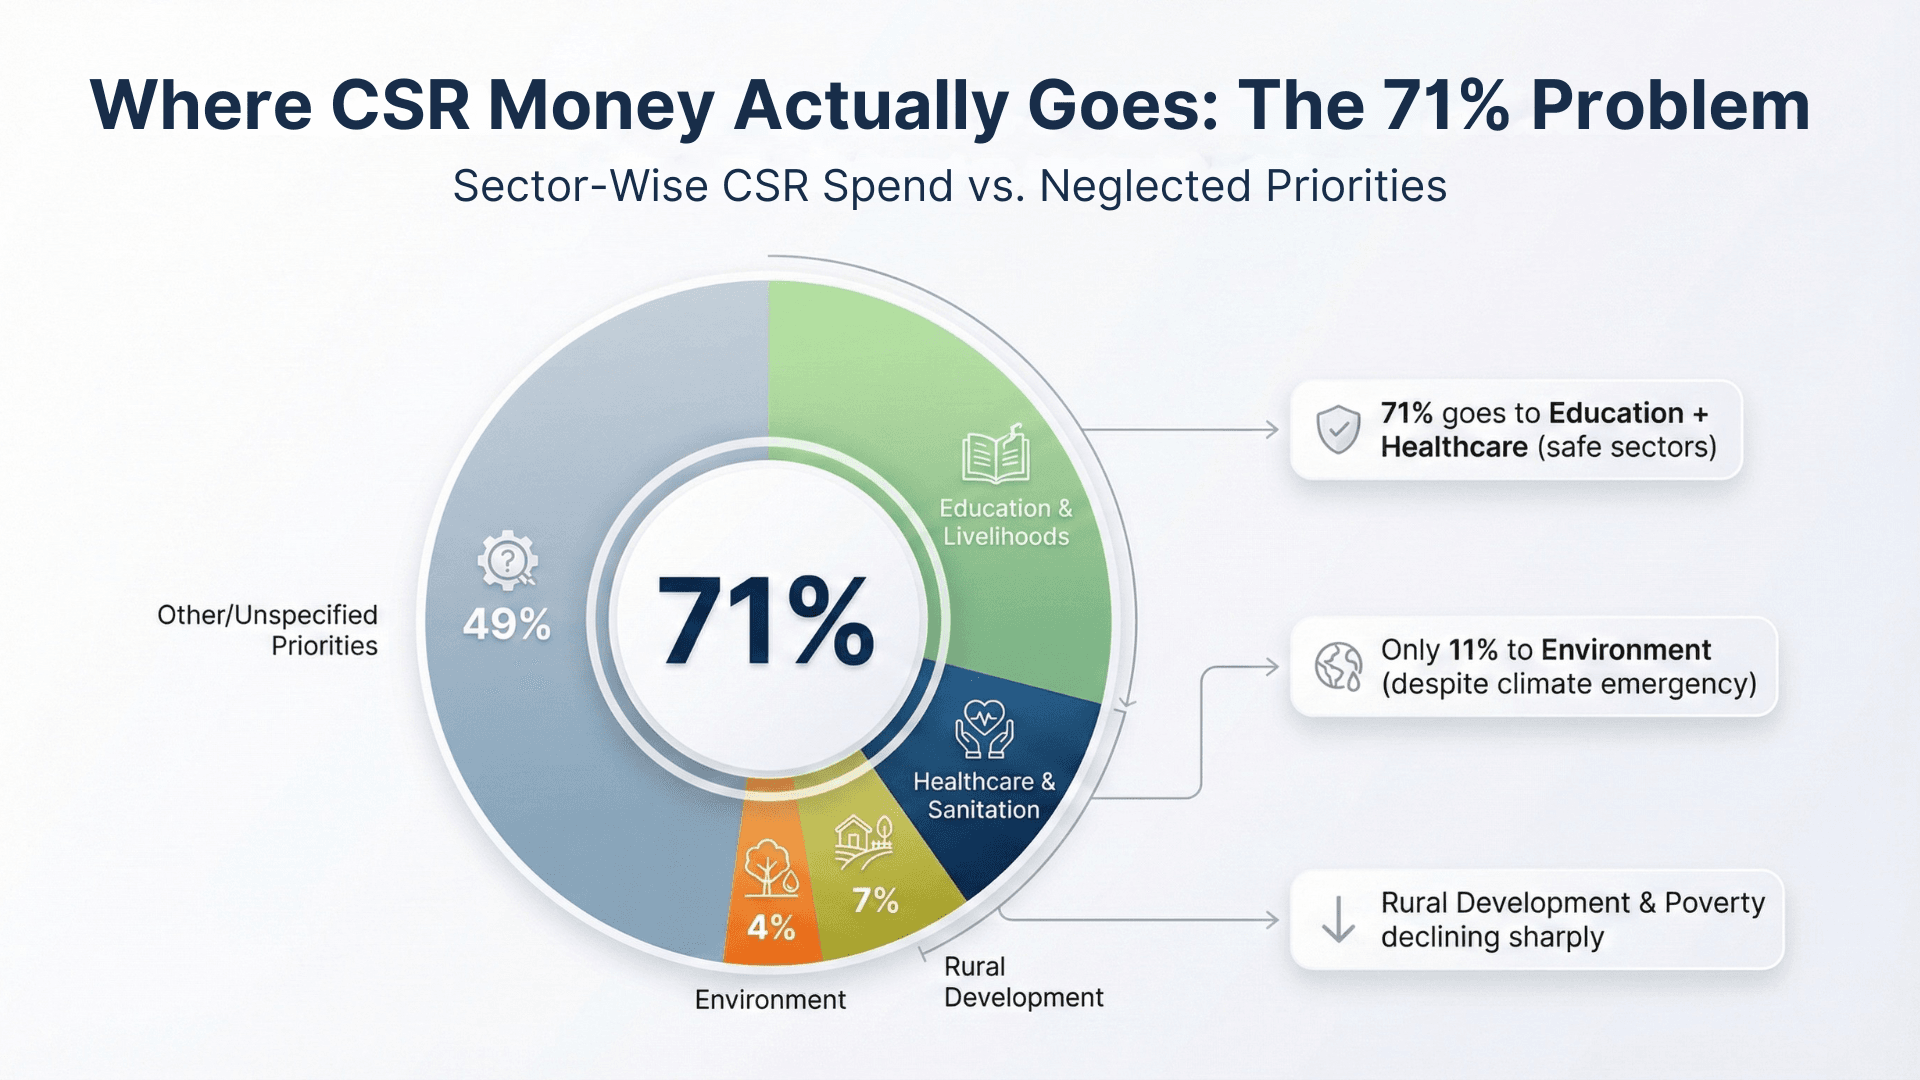
The 71% Problem: Why Companies Still Play It Safe
- 71% of CSR funds go into just two sectors: education and healthcare.
- Education: ₹10,085 crore (29%) for schools, digital literacy, and scholarships.
- Healthcare: ~₹14,700 crore (42%) hospitals, sanitation, maternal health.
On the surface, these are noble causes. Easy to execute, easy to measure, photo‑friendly. Ribbon cuttings, smiling children, and health camps make for great annual reports.
But here’s the catch: safe bets don’t solve hard problems. Rural poverty, climate resilience, and systemic inequality are the areas that need long‑term investment. And they’re being sidelined.
6.1 India's CSR Spending by Sector
Here's where ₹34,908.75 crore was actually deployed across 27,188 companies:
| Rank | Sector (Schedule VII) | Spending | % of Total | What Companies Fund |
|---|---|---|---|---|
| 1 | Education & Livelihoods | ₹10,085 Cr | 29% | School infrastructure, digital literacy, skill training, vocational programs, and scholarships |
| 2 | Healthcare & Sanitation | ₹14,700 Cr (approx.) | 42% | Health camps, hospitals, drinking water (WASH), sanitation, malnutrition programs, and maternal health |
| 3 | Environmental Sustainability | ₹3,800 Cr (approx.) | 11% | Afforestation, waste management, water conservation, biodiversity protection, and climate mitigation |
| 4 | Rural Development | ₹2,400 Cr (approx.) | 7% | Rural infrastructure, sustainable agriculture, and integrated village development |
| 5 | Poverty & Hunger | ₹1,400 Cr (approx.) | 4% | Food distribution, poverty reduction, and malnutrition intervention |
| 6 | Other Sectors | ₹2,523 Cr | 7% | Sports (₹526 Cr), Heritage & Culture (₹441 Cr), PM Relief Fund (₹815 Cr), Women Empowerment, Animal Welfare (₹315 Cr) |
**Data Methodology Note **
We’ve anchored this analysis in publicly available disclosures and government data to keep it transparent and credible.
- Total CSR spending (₹34,908.75 crore): Reported by the Ministry of Corporate Affairs for FY 2023‑24.
- Sectoral percentages (Education 29%, Healthcare 42%, etc.): Based on FY 2022‑23 MCA data patterns. The FY 2023‑24 sectoral breakdown isn’t yet published, so we’ve applied last year’s ratios to this year’s totals to estimate allocations.
- Sectoral rupee amounts (₹10,085 Cr, ₹14,700 Cr, etc.): Approximate figures calculated using those percentages.
- Growth/decline trends (e.g., +54% for environment, –59% for rural development): Derived from the listed companies subset (₹17,967 crore) in the PRIME Database for FY 2023‑24.
- Sources: MCA National CSR Portal, PRIME Database, Economic Survey 2023‑24, and Parliamentary data (Lok Sabha Question 2501).
In short: the numbers are real, the sector splits are best‑fit estimates, and the trends are directionally accurate. We’ve chosen transparency over precision because executives need clarity to act, not just decimals to quote.
Sources: MCA National CSR Portal, PRIME Database, Economic Survey 2023-24, Parliamentary data (Lok Sabha Question 2501)
6.2. The Loser: Environment Gets Just 11% But It's Growing
Despite India’s Net‑Zero 2070 commitment, environmental sustainability still attracts only ₹3,800 crore (11%).
Why companies avoid it:
- Long gestation trees planted today show results in 10–15 years.
- Hard to measure biodiversity doesn’t fit neatly into an annual report.
- High-risk afforestation projects fail without maintenance.
- Low PR value, a check dam doesn’t photograph as well as a school opening.
The silver lining? Environmental CSR grew 54% year‑on‑year among listed companies. Climate consciousness is finally translating into budgets, though from a very low base.
6.3 The Missing Middle: Rural Development + Poverty = Only 11%
Together, rural development (7%) and poverty/hunger (4%) barely reach ₹3,800 crore.
Think about that: India is 65% rural, with nearly 30% of the population living near or below the poverty line. Yet systemic rural transformation and poverty reduction, the hardest, most important work, gets scraps.
Even worse, spending is declining:
- Rural development down 59%.
- Slum development down 72%.
- Disaster management is down 77%.
This is the paradox: companies spend billions, but the sectors that could create transformational change remain chronically underfunded.
6.4 The Forgotten Few: What Got Left Behind
Beyond the “Big Four” sectors, several critical areas barely register
- Sports & Grassroots Athletics: ₹526 crore (1.5%)
- Heritage, Art & Culture: ₹441 crore (1.3%)
- PM National Relief Fund: ₹815 crore (2.3%) down sharply from ₹1,698 crore in FY21
- Animal Welfare: ₹315 crore (0.9%), though this surged from just ₹17 crore in FY15
- Armed Forces Veterans' Welfare: Declined by 52% in FY24
- Technology Incubators: A mere ₹1 crore down from ₹8.6 crore the previous year
These areas matter for social fabric and resilience, but they’re treated as afterthoughts.
The Real Lesson
CSR in India has become a system where doing the bare minimum gets you a trophy. Companies tick the compliance box, publish glossy photos, and move on.
But compliance isn’t a consequence. The leaders of tomorrow will be those who fund the hard stuff, rural transformation, poverty reduction, and climate resilience, and prove impact that lasts longer than an annual report cycle.
7. The CSR Geography Scandal: India's Development Divide Reinforced by Corporate Spending
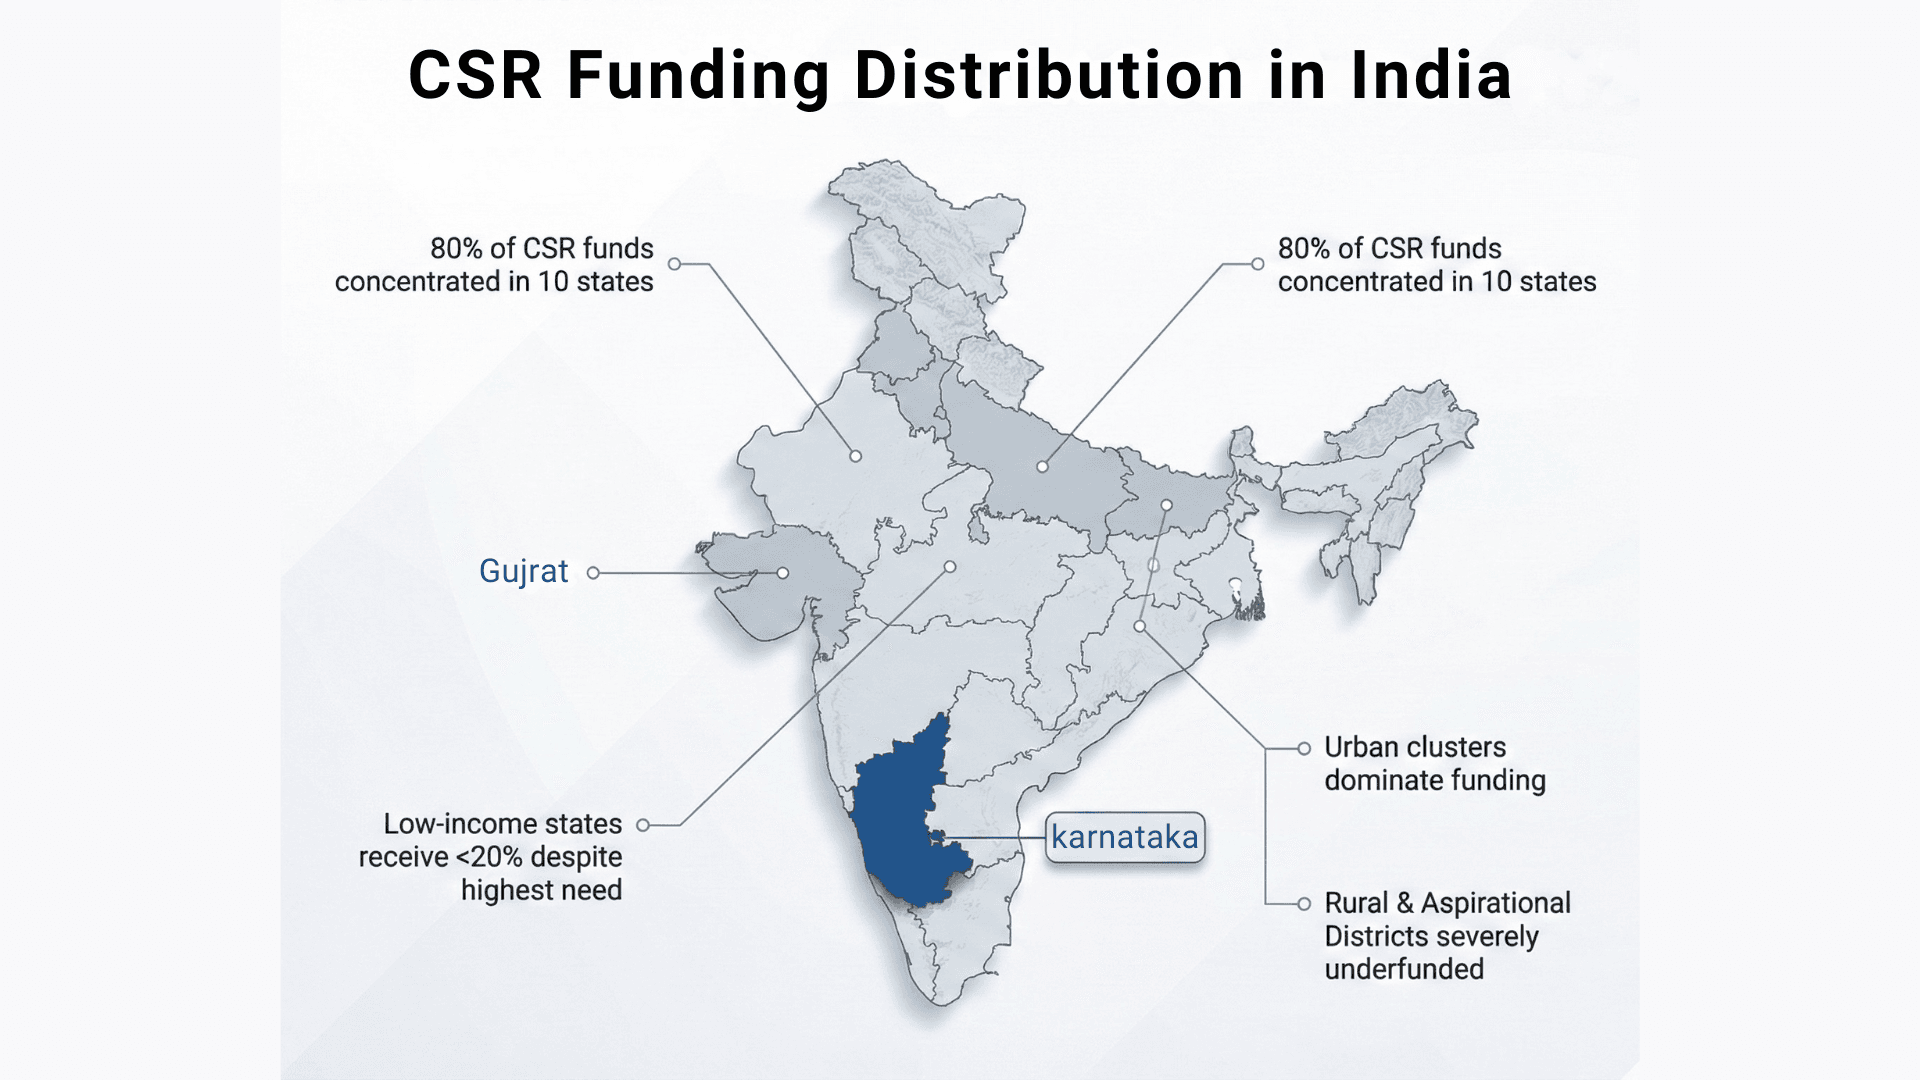
Here's the most damning pattern in Indian CSR: the richest states receive the most funding, while the poorest regions receive the least. This isn't an accident; it's systematically reinforced by how India's CSR law is written and implemented.
7.1 The Geographic Concentration: Where CSR Money Actually Goes
7.1.1 State-Wise Distribution (Latest Complete Data for All Companies)
Source: Ministry of Corporate Affairs via Drishti IAS | Economic Survey 2023-24
| State Category | FY 2022–23 CSR Receipt | % of Total (₹29,987 Cr) | Development Status |
|---|---|---|---|
| Maharashtra | ₹5,706 crore | 17.9% | India's wealthiest state by GDP |
| Top 5 States (MH, KA, GJ, TN, Delhi) | ~₹12,700 crore | ~41% | Industrial powerhouses |
| Top 10 States | ~₹18,300 crore | ~60% | Already developed regions |
| North-East States (Mizoram, Sikkim, others) | Minimal (Mizoram: ₹6.9 crore) | <1% | Among India's poorest regions |
| Lakshadweep, Leh & Ladakh | Minimal | <0.5% | Geographically isolated, high need |
7.1.2 Listed Companies Data (Subset of 1,394 Companies, ₹17,967 Crore)
Source: PRIME Database via Business Today
| Rank / Category | State | CSR Received | Key Insight |
|---|---|---|---|
| 1 | Maharashtra | ₹266.14 crore | Highest recipient |
| 2 | Rajasthan | ₹242.58 crore | Mining & industrial corridor |
| 3 | Tamil Nadu | ₹215.13 crore | Manufacturing hub |
| 4 | Gujarat | ₹210.49 crore | Business headquarters cluster |
| 5 | Telangana | ₹136.00 crore | IT sector concentration |
| Top 10 States | — |
The Reality: The top 10 states consistently account for 60% of total CSR expenditure, regardless of fiscal year or dataset examined.
7.2 The Aspirational Districts Crisis: India's Poorest Get Just 2-5%
7.2.1 What Are Aspirational Districts?
In January 2018, NITI Aayog identified 115 districts across 28 states as India's most developmentally challenged areas (now 112 districts participate, as West Bengal opted out). These districts represent 15% of India's population but have the worst indicators in health, education, agriculture, and infrastructure.
7.2.2 CSR Allocation to Aspirational Districts: A Decade of Neglect
Sources: Sattva Consulting/India Data Insights | Economic Times | IDR Analysis
| Time Period | CSR to Aspirational Districts | % of Total CSR | Key Finding |
|---|---|---|---|
| 2014–2023 (Cumulative 9 years) | ₹4,594 crore | 2.5% | Out of ₹1.84 lakh crore total CSR spending |
| FY 2022–23 | ₹1,355 crore | 4.5% | A 30% increase from the previous year |
| Top 100 Companies (FY 2023) | ₹473 crore | 3% | Even top spenders allocate minimally |
The Brutal Truth: Despite government advocacy for CSR investment in Aspirational Districts, less than 2-5% of total CSR funds reach these regions, which house India's poorest and most underserved populations.
7.2.3 Top 5 States Receiving Aspirational District CSR
Source: Sattva Consulting
- Madhya Pradesh: 9.8% of AD CSR
- Andhra Pradesh: 8.4%
- Jharkhand: 7.1%
- Chhattisgarh: 6.5%
- Gujarat: 6.3%
More than half (53%) of total CSR funds to Aspirational Districts are spent in just five states: Madhya Pradesh (₹448 Cr), Andhra Pradesh (₹387 Cr), Jharkhand (₹328 Cr), Chhattisgarh (₹301 Cr), and Gujarat (₹291 Cr).
7.3 The Legal Loophole Driving Geographic Inequality
7.3.1 Section 135(5): The "Local Preference" Clause
Full Text of Law:
"The Board of every company... shall ensure that the company spends... at least two per cent of the average net profits... Provided that the company shall give preference to the local area and areas around it where it operates, for spending the amount earmarked for Corporate Social Responsibility activities."
Companies Act, 2013, Section 135(5)
Source: Companies Act 2013 - Indian Kanoon
7.3.2 Why This Clause Destroys Geographic Equity
1. Corporate Headquarters Cluster in Wealthy States
Where are India's most profitable companies located?
Banks (HDFC, ICICI): Mumbai, Bangalore IT Companies (TCS, Infosys, Wipro): Bangalore, Hyderabad, Pune Manufacturing/PSUs (Tata Steel, ONGC, IOC): Near existing factories, refineries, mining sites Result: CSR spending concentrates in industrial states like Maharashtra, Karnataka, Gujarat, and Tamil Nadu
2. The Compliance Incentive Structure
Spending "Locally" Is:
- ✅ Administratively simpler (easier site visits, monitoring)
- ✅ Legally encouraged (fulfills Section 135(5) preference)
- ✅ Lower risk (familiar terrain, existing NGO partners)
- ✅ Better for optics (easier for board members to visit projects for photo-ops)
- ✅ Cost-effective (lower travel and setup costs)
Spending in Aspirational Districts Is:
- ❌ Logistically complex (remote locations, poor infrastructure)
- ❌ Higher execution risk (fewer established implementing partners)
- ❌ More expensive (significant travel, accommodation, setup costs)
- ❌ Legally optional (law says "preference," not "requirement")
- ❌ Harder to monitor (distance makes M&E expensive)
What Would You Do If You're a CSR Manager?
You'd spend locally. Check the legal box. Avoid complications. Get your annual report photos. Meet your KPIs. Move on.
And that's exactly what happens in 98% of companies.
7.3.3 The Legal Reality
Section 135(5) states that companies "should give preference to local areas," but this preference is directory (advisory), not mandatory. But, in practice, companies
treat it as an implicit mandate because:
It's the path of least resistance Auditors and boards approve local spending faster There's no regulatory penalty for avoiding high-need regions There's no regulatory reward for targeting Aspirational Districts
The Result: A significant portion of CSR funds (nearly 60%) is directed towards states like Maharashtra, Karnataka, Tamil Nadu, and Gujarat, which are already performing well on socio-economic indicators. In contrast, northeastern states and Bihar, which have higher poverty rates and developmental needs, receive minimal CSR funds.
This is exactly backwards.
7.4 What This Geographic Inequality Actually Means for India
This CSR concentration has devastating long-term consequences:
7.4.1 ❌ Reinforces Existing Disparities
Rich states get richer, poor states stay poor. This geographic skew perpetuates regional development disparities, contradicting CSR's core objective.
7.4.2 ❌ Defeats the Law's Intent
CSR was meant to redistribute private profits for the public good. Instead, it concentrates benefits in already well-performing states, making inequality worse.
7.4.3 ❌ Wastes High-Impact Opportunities
₹1 crore in Jharkhand creates far more marginal impact than ₹1 crore in Mumbai, where infrastructure already exists. Overfunding already-developed regions creates diminishing returns.
7.4.4 ❌ Misallocates National Resources
How many more schools does South Mumbai need? Meanwhile, 78% of Jharkhand's population lives in Aspirational Districts with inadequate health, education, and water infrastructure.
7.4.5 ❌ Perpetuates Migration Crisis
Young people flee underfunded rural areas for cities, worsening urban strain and rural depopulation.
7.4.6 ❌ Undermines Democratic Legitimacy
When private wealth concentrates benefits in already-rich regions, it deepens the sense that development is a privilege, not a right.
7.5 What Needs to Change (But Probably Won't Without Reform)
7.5.1 Policy Interventions Required:
- Geographic Allocation Mandate
- Require a minimum of 15% of CSR to Aspirational Districts (matching their population share)
- Phase in over 3 years to allow planning
- Incentive Restructuring
- Tax benefits for companies spending in high-need regions
- An additional 0.5% tax deduction for AD spending beyond the minimum
- Section 135(5) Amendment
- Change "preference" to "balanced allocation considering national development priorities."
- Require justification for geographic concentration
- Transparency Requirements
- Mandatory district-level spending disclosure
- Public dashboard showing state-wise per capita CSR investment
- Collaborative Implementation Infrastructure
- Government-funded CSR hubs in Aspirational Districts
- Pre-vetted implementing partners to reduce corporate risk
- Shared M&E infrastructure to lower monitoring costs
7.5.2 Reality Check:
Without regulatory change, the 60/6 concentration will persist. Companies optimise for compliance and convenience, not equity. The current system makes it easier, cheaper, and safer to spend in Maharashtra than in Jharkhand's tribal belts.
Until the law changes the incentives, CSR will continue to make rich states richer while India's poorest regions remain developmentally starved.
8. CONCLUSION

The Companies Getting It Right:
- HDFC Bank: 100 million beneficiaries through 214 partner organisations using its integrated HRDP model
- **TCS: **8.93 million volunteer hours, third-party verified impact, technology-driven scale
- Reliance Industries: 35% year-on-year increase, ₹23.29 crore specifically in 20 Aspirational Districts
- ICICI Bank: 54% spending increase, reaching 1.89 crore people with genuine commitment
These leaders prove that compliance and consequence can coexist, but they remain exceptions, not the rule.
The Path Forward: Indian CSR needs to evolve from compliance-driven to impact-driven. This requires:
- Sectoral balance: More funding for climate, rural transformation, and poverty eradication
- Geographic equity: Mandatory allocations to high-need regions
- Long-term commitment: Multi-year programs over annual one-offs
- Impact transparency: Third-party verified outcomes, not just output metrics
- Policy reform: Incentivise companies to tackle hard problems in difficult geographies
The Bottom Line: India Inc. is spending more than ever on CSR. But until companies start funding the hardest problems in the places that need it most, rather than the easiest projects in the most convenient locations, CSR will remain a story of high expenditure and limited transformation.
Frequently Asked Questions
1. Which company spent the most on CSR in India in FY 2023‑24?
HDFC Bank led with ₹945.31 crore, followed by Reliance Industries (₹900 crore) and TCS (₹827 crore). HDFC’s flagship program Parivartan runs through its Holistic Rural Development Programme (HRDP), reaching 9,000+ villages and covering 85 of India’s 112 Aspirational Districts the widest private‑sector coverage.
2. Why is 73% of CSR spending concentrated in education and healthcare?
These sectors are easy to execute, measure, and report. Companies can count classrooms built or patients treated, metrics that look good in annual reports. They also deliver quick wins: 1–2 year turnarounds, ribbon‑cutting ceremonies, and strong PR value. In contrast, areas like environmental sustainability (just 10%) demand long‑term commitments, complex measurement, and offer less immediate visibility.
3. Why does Maharashtra receive 17% of all CSR spending while poorer states get less than 2%?
Maharashtra attracts ₹6,066 crore (17%) of national CSR, while states like Jharkhand and Bihar get under 2% each, despite higher poverty rates. Why? Section 135(5) of the Companies Act nudges companies to spend in “local areas” near their operations. With most corporate HQs in Mumbai and Pune, Maharashtra becomes the default choice, simpler to administer, easier to monitor, and legally encouraged.
4. What are Aspirational Districts, and why do they receive only 20% of CSR funds?
Aspirational Districts are 112 regions identified by the Government of India with the weakest indicators in health, education, infrastructure, and poverty. Despite being the highest‑need areas, they receive less than 20% of CSR spending (~₹3,600 crore). Companies often avoid them due to poor infrastructure, higher execution risk, and limited PR value. HDFC Bank is a rare exception, covering 85 of 112 districts.
5. What’s the difference between CSR compliance and CSR impact?
Compliance: Meeting the legal requirement to spend 2% of profits. Over 98% of eligible companies achieve this. Impact: Creating measurable, lasting social change. Few companies prove this with verified data. Example: A firm can spend ₹500 crore on one‑off projects and still be compliant. True impact means multi‑year commitments, third‑party monitoring, and outcomes like “improved reading proficiency by 2 grade levels” — not just “built 50 schools.”
6. What is Section 135(5) and why is it controversial?
Section 135(5) of the Companies Act requires companies to give preference to local areas around their operations. Sounds reasonable, but here’s the problem: most profitable companies are headquartered in wealthy states like Maharashtra, Karnataka, Tamil Nadu, and Gujarat. Result? 60% of CSR funds concentrate in just six states, while tribal belts, the Northeast, and Aspirational Districts remain underfunded.